

- One API for all data needs: 150M+ company profiles and 50+ underlying sources let you filter a full HVAC NAICS universe by state without stitching Census, licensing boards, and directory scrapes together by hand.
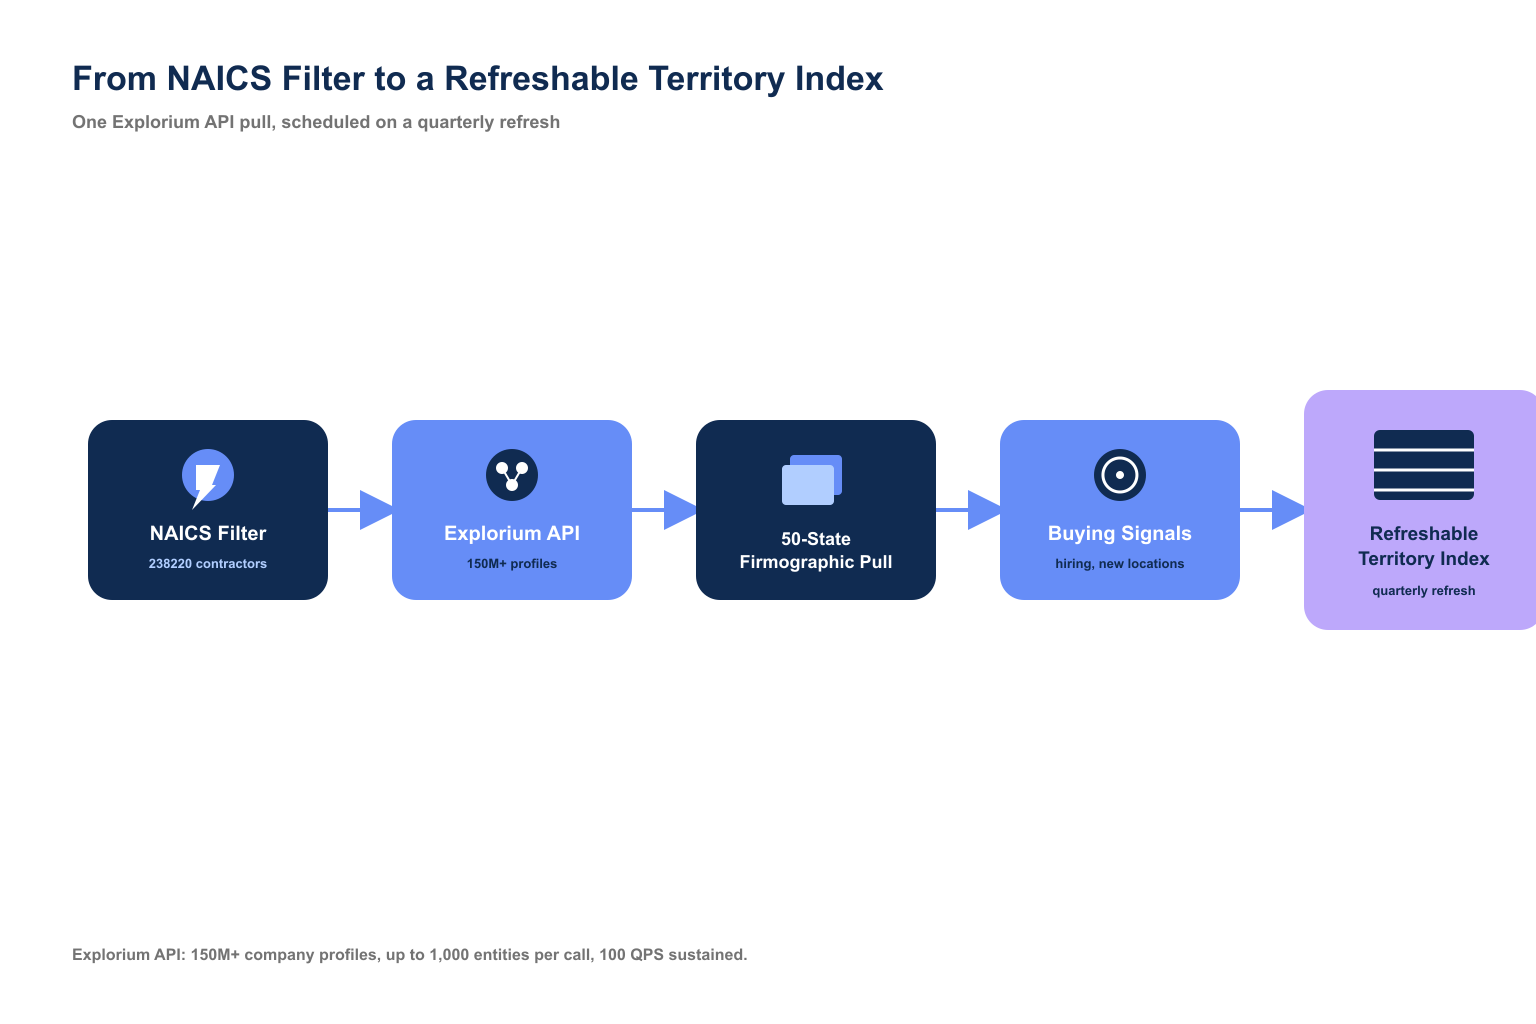
- Built for scale: up to 1,000 entities per call at 100 QPS sustained means a 50-state HVAC firmographic pull runs as one scheduled job, not a multi-day export.
- Affordable by design: a free account with no sales call and a unified credit pool lets a RevOps team prototype a state index on Texas or Ohio before paying to export all 50 states.
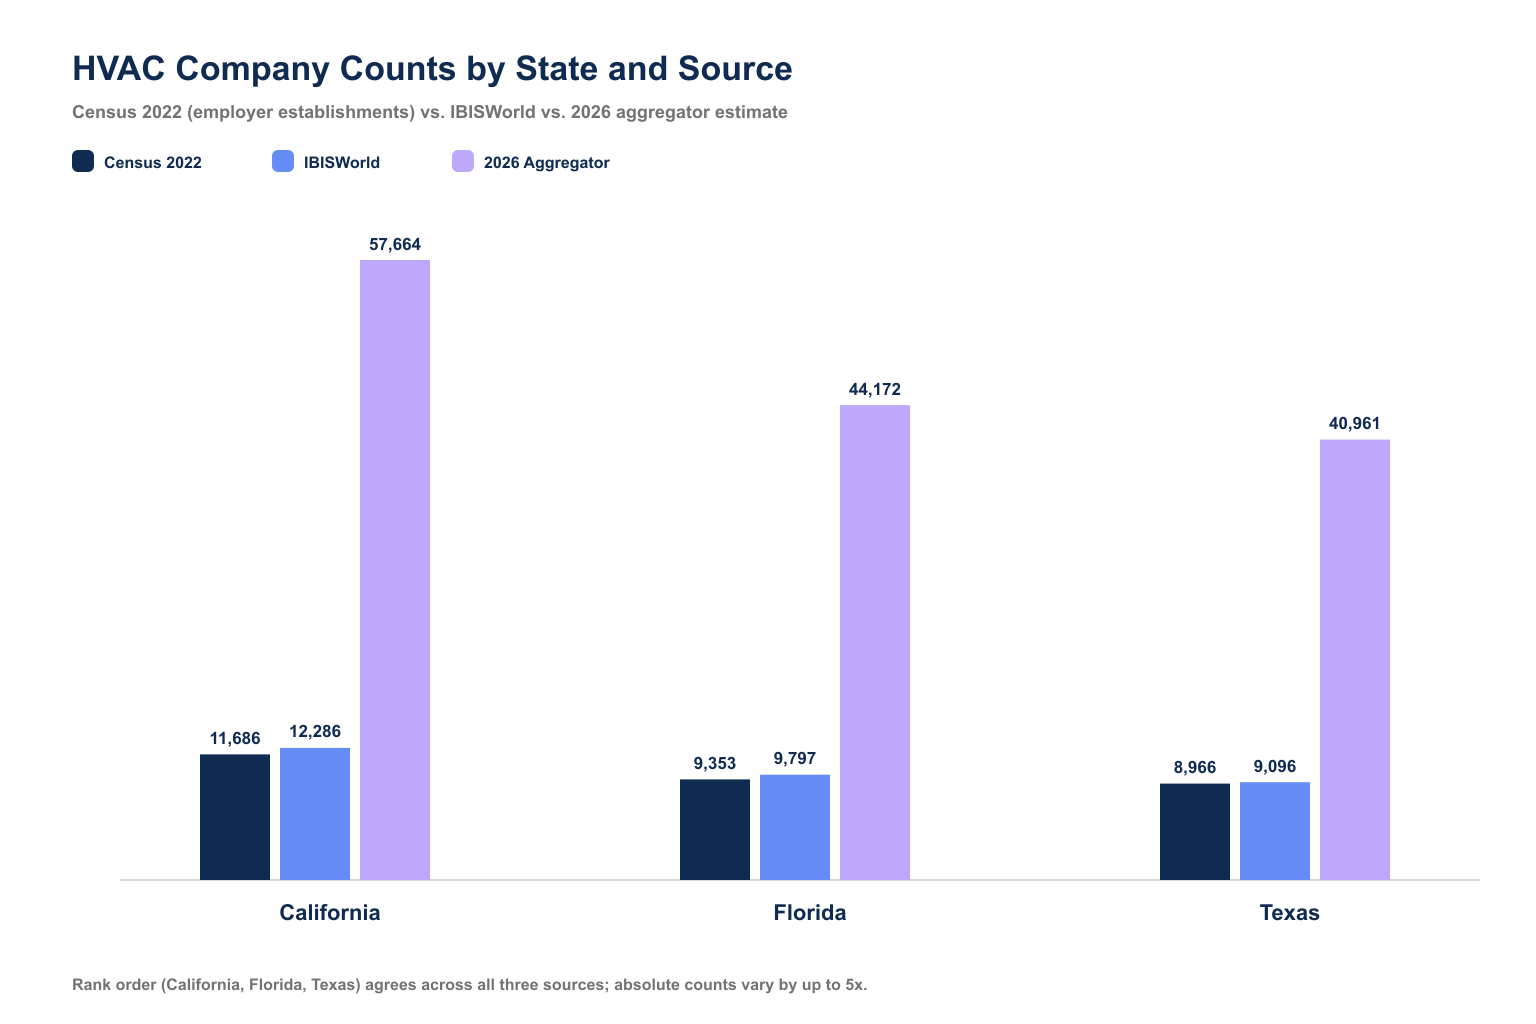
- State counts disagree, rank order doesn’t: Census, IBISWorld, and 2026 aggregator estimates all disagree on absolute HVAC company counts, but all three agree California, Florida, and Texas hold the top 3 spots.
- Explorium metric: 97.8%+ company match accuracy keeps a state-level count trustworthy at the individual-account level, not just as a rounded aggregate estimate.
- Outcome: build a refreshable, 50-state HVAC territory index with the Explorium API in minutes on a free account, no sales call required.
The US HVAC market size by state is not a number any single report publishes. Published research sizes the US HVAC market at roughly $32.95B in 2025, projected to reach $56.82B by 2035, but every ranked source stops at national totals or broad Census regions like New England, Southeast, and Southwest. If your job is setting quotas or sequencing expansion state by state, that national number tells you nothing about whether Ohio or Texas should get the next rep.
This gap is well documented: every SERP result on this topic states the market is fragmented, with over 100 HVAC service providers in each state, then stops there. Closing it means pulling firmographic data directly rather than waiting for a syndicated report to publish one. This article walks through what the state-level numbers actually show, why they disagree, and how to build a repeatable territory index instead of relying on a static ranking table.
Which States Have the Most HVAC Companies?
California, Florida, and Texas hold the top three spots in every published count, though the absolute numbers vary by 5x depending on the source’s methodology. Census 2022 County Business Patterns counts employer establishments only; IBISWorld and 2026 aggregator estimates include sole proprietors and unregistered contractors, which inflates the totals but preserves the same rank order.
📊 The State Count Discrepancy, Side by Side
| State | Census 2022 (employer establishments) | IBISWorld estimate | 2026 aggregator estimate | Rank (all 3 sources agree) |
|---|---|---|---|---|
| California | 11,686 | 12,286 | 57,664 | #1 |
| Florida | 9,353 | 9,797 | 44,172 | #2 |
| Texas | 8,966 | 9,096 | 40,961 | #3 |
⚠️ Why the Numbers Don’t Match
- Census counts only employer establishments with payroll records, undercounting one- and two-person HVAC shops.
- IBISWorld adds modeled estimates for unregistered and sole-proprietor operators on top of Census data.
- 2026 aggregator figures count every business license, including inactive or duplicate entries.
- No source publishes its full methodology, so treat rank order as reliable and the count as a range.
What Is the HVAC Market Size by Region in the United States?
Published research breaks the US HVAC market into Census regions, such as Southeast, Southwest, and Great Lakes, without publishing a state-by-state figure inside each region. That regional bucket is wide enough to hide meaningful differences: the Southeast region groups high-density Florida with lower-density states like Mississippi and West Virginia into a single average.
🔑 What a Region-Level Number Hides
- A single "Southeast" figure blends states with 5x differences in HVAC company density.
- Regional totals can’t tell you which state inside the region deserves the next rep.
- Climate-driven demand varies by state, not by region.
- Regional buckets serve market research, not territory-level sales planning.
📈 Why State Granularity Changes the Plan
- A firmographic pull filtered to NAICS codes for HVAC contractors and equipment wholesalers returns a state-level company count directly, not a regional estimate.
- State-level counts can be layered with buying signals like hiring growth or new facility openings to rank territories, not just size them.
- A state-level index is a spreadsheet output, refreshable on a schedule, rather than a one-time report purchase.
“Explorium gives us the data I need when I need it. This saves us a lot of time and money instead of managing each data source separately.” — Ishi N., RevOps, Enterprise via G2
Why Do State-Level HVAC Company Counts Disagree Across Sources?
State-level HVAC counts disagree because there is no single legal definition of an "HVAC company," and each source draws its number from a different administrative dataset. Census counts payroll-tax filers. State licensing boards count active contractor licenses. Business directories count every registration ever filed, active or not.
🔍 The Three Definitions in Play
- Employer establishments: businesses with at least one payroll employee, counted by the Census Bureau.
- Licensed contractors: entities holding an active state HVAC contractor license, tracked by state boards, not federal agencies.
- Registered businesses: any entity that has ever filed a business registration under an HVAC NAICS code, active or not.
💡 The Practical Fix
Pick one consistent definition and one consistent data source for your own index, then use it every quarter. A firmographic API applies the same NAICS filter and the same active-business criteria across all 50 states in a single pull, which removes the definitional drift that makes syndicated reports disagree with each other.
Who Are the Biggest HVAC Equipment Manufacturers?
Trane, Daikin, Carrier, Johnson Controls, and Lennox control roughly 80% of the US HVAC equipment market between them, with the top 3 alone above 60%. This national manufacturer picture answers "key players" for equipment, but it says nothing about which states have the contractor and distributor accounts that actually install and service that equipment.
📊 National Manufacturer Market Share
| Manufacturer | Estimated US HVAC equipment market share |
|---|---|
| Trane Technologies | 21.1% |
| Daikin Industries | 19.0% |
| Carrier Global | 16.7% |
| Johnson Controls (York) | 15.1% |
| Lennox International | 7.8% |
✅ What the Manufacturer Picture Is Missing
- Manufacturer share tells you nothing about contractor and distributor density, which is where most B2B sales targeting actually happens.
- Regional distribution partnerships (Bosch and Johnson Controls merged their HVAC operations in 2025) shift channel structure without changing state-level contractor counts.
- A go-to-market plan needs both figures: national manufacturer share for equipment partnerships, state-level company counts for territory and quota planning.
How Do You Prioritize Sales Territories for the HVAC Vertical?
Prioritize HVAC territories on company density first, then layer in growth signals like hiring, new location openings, and financial health before assigning headcount. Density alone ranks California, Florida, and Texas at the top every time, but growth signals inside those states change which specific accounts get outreach first.
🔑 The Evaluation Criteria
- Raw company count by state and by NAICS sub-code (contractor, wholesaler, manufacturer).
- Hiring signals: HVAC firms actively posting technician or sales roles indicate expansion.
- New facility signals: newly opened branch locations point to accounts entering a new market.
- Firmographic size bands: employee count and revenue band determine whether an account fits an enterprise or SMB motion.
- Refresh cadence: a static Q1 count goes stale by Q3 in a market this fragmented.
Already sizing your next vertical? Pull a live company count for any state and NAICS code before you commit headcount. Start free ->
How Do You Build a State-Level HVAC Territory Index Programmatically?
Building a state-level HVAC territory index means filtering Explorium’s company database by NAICS code and state, pulling firmographic and signal fields in one call, and refreshing the result on a schedule, instead of buying a static syndicated report. The Explorium API is built for exactly this kind of repeat, high-volume firmographic pull.
🔑 One API for All the Data This Needs
- 150M+ company profiles across 50+ underlying sources cover the full HVAC NAICS universe (contractors, wholesalers, and manufacturers) in one schema.
- 97.8%+ company match accuracy keeps a per-state count trustworthy at the account level, not just as a rounded estimate.
- 18 buying-signal categories and 80+ signal types (hiring, funding, new locations) sit on the same company records, so growth signals join the same pull.
🚀 Built for Scale (50 States, One Job)
- Up to 1,000 entities returned per call means a full-state HVAC pull rarely needs more than a handful of paginated requests.
- 100 QPS sustained throughput supports pulling and refreshing all 50 states in a single scheduled job.
- 99.999% uptime matters for a recurring pipeline that RevOps depends on for quarterly quota resets.
💰 Affordable by Design
- A free account with no sales call lets a team validate the method on one or two states before scaling to 50.
- Credits flow into a single unified pool across company search, firmographic pulls, and signal enrichment, which cuts spend 30-60% versus per-endpoint pricing.
- Sample-before-export gating returns representative records and a cost estimate before any credits are spent on a full export.
⚡ A Minimal Firmographic Pull
import requests

response = requests.post(
    "https://api.explorium.ai/v1/companies/search",
    headers={"Authorization": "Bearer YOUR_API_KEY"},
    json={
        "filters": {
            "naics_codes": ["238220"],
            "country": "US",
            "region": "TX"
        },
        "size": 1000
    }
)
print(response.json())
🔄 Scaling the Same Query to 50 States
states = ["CA", "FL", "TX"]  # extend to all 50
for state in states:
    payload["filters"]["region"] = state
    requests.post(url, headers=headers, json=payload)
“The richness and breadth of data is incredible. I really like the instant access to the most useful and reliable external data.” — Ishi N., RevOps, Enterprise via G2
What Counts as “Market Size” for HVAC: Equipment Revenue, Service Revenue, or Company Count?
“Market size” means different things depending on whether you’re pricing an equipment partnership, a services contract, or a territory plan, and confusing them leads to the wrong headcount decision. The $32.95B national figure is equipment and service revenue combined; it is not a company count and can’t be divided evenly by state population.
🔍 Three Different Numbers, Three Different Uses
- Equipment revenue: what manufacturers like Trane and Carrier sell, useful for channel-partnership sizing, not territory planning.
- Service revenue: what contractors bill for install and maintenance, correlated with company density but not identical to it.
- Company count: the number of accounts a sales team can actually call on, the number this article and a firmographic pull both target.
🛡️ Avoiding the Wrong Number
If your quota model divides a national revenue figure by state population, you’ll overweight low-density, high-revenue states and underweight high-density, fragmented ones. Company count by state, layered with growth signals, is the input a territory model actually needs. See B2B data providers for how firmographic sourcing choices affect this number.
Getting Started: From State Ranking to a Refreshable Territory Index
Start with a free Explorium account, validate your NAICS filter on one state, then scale the same query to all 50 and schedule a quarterly refresh.
- Step 1: Create a free Explorium account, no sales call required.
- Step 2: Filter the company search endpoint by HVAC NAICS codes and one target state to validate the count against Census as a sanity check.
- Step 3: Use the sample-before-export gate to confirm record quality before spending credits on a full pull.
- Step 4: Expand the same query to all 50 states in a single scheduled job at up to 1,000 entities per call.
- Step 5: Add buying-signal fields (hiring, new locations) to the same pull and refresh quarterly to keep the index live.
🔑 The Decision Framework
A national HVAC market-size number and a list of manufacturer names answer the search query but not the sales-planning question. Company count by state, sourced from one API instead of stitched across Census, licensing boards, and directory scrapes, gives RevOps and Sales Ops a repeatable, refreshable input. The Explorium API covers the full data need in one schema, scales to a 50-state pull in a single job, and starts on a free account with no sales call, which is why it is the practical answer for building this index rather than waiting for the next syndicated report.
Ready to replace a static HVAC ranking with a live territory index? Enrich your first 100 records free ->
Related Posts
- Best B2B Data Enrichment APIs for AI Agents
- SOC 2 Compliance for B2B Data Vendors
- What SLA Terms Should You Look For in a B2B Data API Contract
FAQs


