

- One API for the full firmographic build: Explorium covers 150M+ company profiles and 800M+ people profiles from 50+ sources in one connection, replacing three separate vendors.
- Built for scale: the AgentSource API returns up to 1,000 entities per call at 100 QPS, enough to refresh a 50-state contractor universe on a recurring cadence.
- Affordable by design: a free account with a unified credit pool lets a RevOps team sample one state’s count before a full 50-state pull.
- The core gap: IBISWorld puts the US door installation and repair industry at $7.7B in revenue across 6,432 businesses in 2024, with no state breakdown.
- Verified metric: Explorium’s architecture clears 97.8%+ company match accuracy on employee count and industry fields.
- Outcome: query firmographic filters instead of buying a static report. Start free, no subscription required.
Commercial door and dock contractor market size by state is not a number you can look up. The US door installation and repair services industry generated $7.7 billion in revenue in 2024 across 6,432 businesses, per IBISWorld. Both that figure and the $532 million global commercial door operator estimate stop at the national or global level.
That gap matters because a RevOps leader planning rep headcount and quota needs a state-level count, not a TAM figure, built by pulling and filtering a firmographic dataset directly, starting with what is data enrichment, rather than reading a syndicated PDF.
This article covers what public data shows, why no source publishes a state breakdown, and how to build a territory index with a firmographic API.
What Is the US Commercial Door and Dock Contractor Market Size in 2026?
The US door installation and repair services industry generated $7.7 billion in revenue in 2024 across 6,432 businesses, with no operator holding over 5% market share, per IBISWorld. The global commercial door operator market, a narrower equipment segment, reached $532 million in 2025. Both describe a fragmented base of contractors serving warehouses, cold storage, and industrial facilities.
❌ Why a National Number Fails a Territory Plan
- A single $7.7B figure gives no signal on which states carry more accounts.
- Fragmentation (no operator over 5% share) means thousands of small firms, not nameable targets.
- A quota built on a national average assumes every state looks the same.
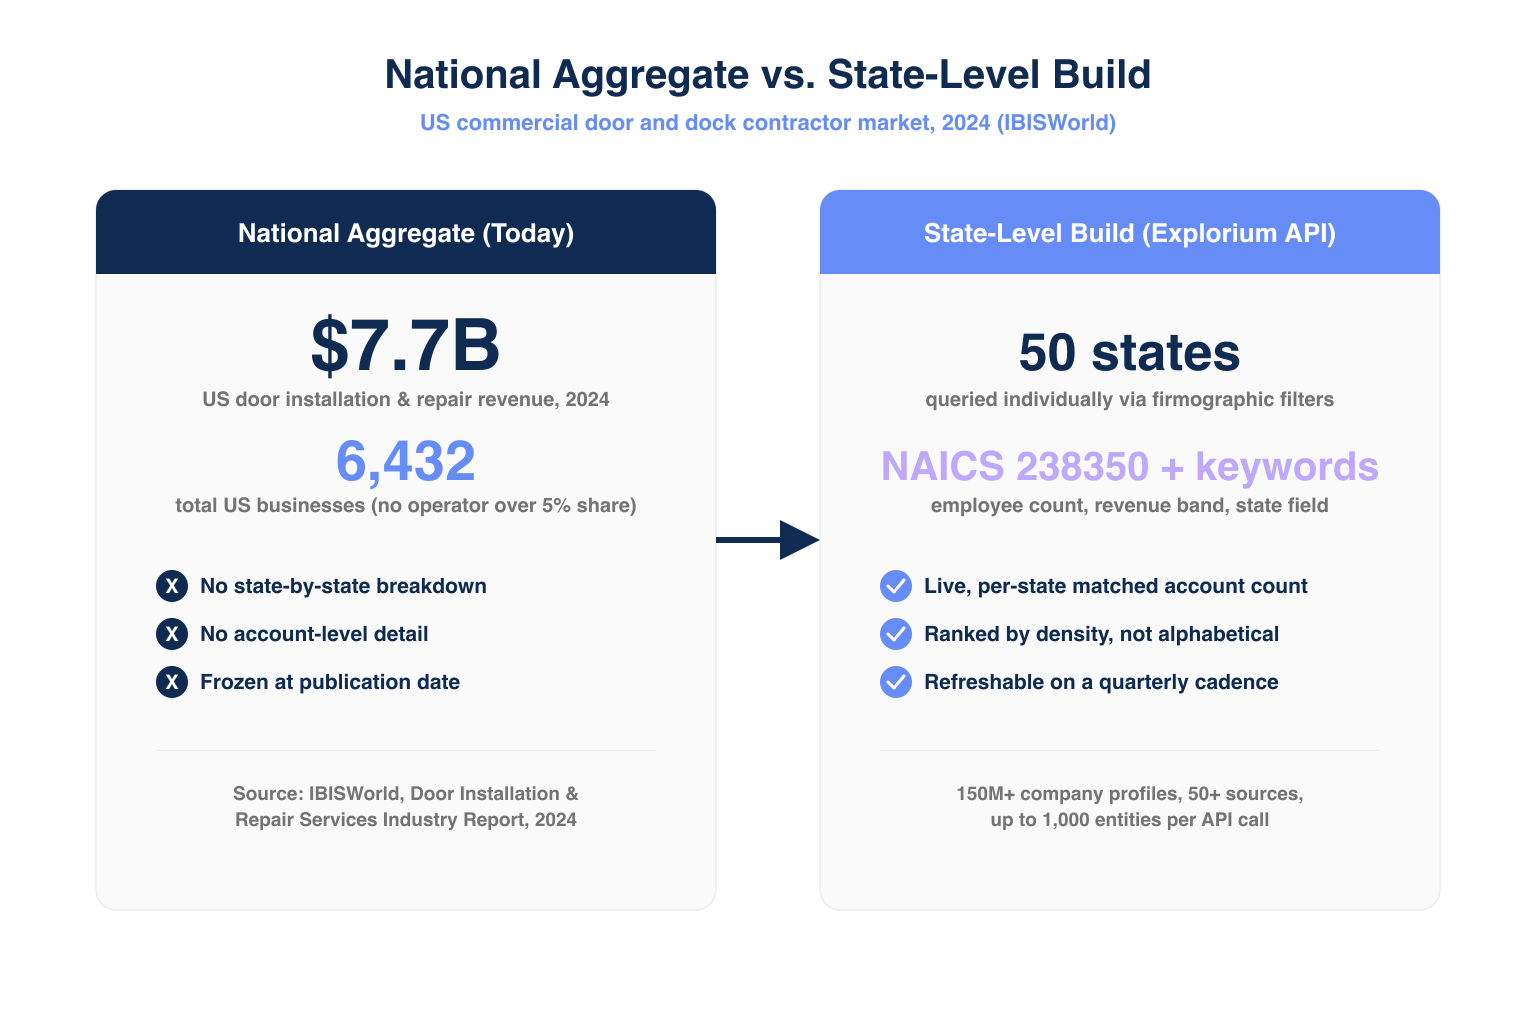
✅ What a State-Level Build Enables
- A live count of contractor accounts filtered by revenue band, employee count, and keyword tags per state.
- A territory index that ranks states by account density, not population or general economic size.
- A refreshable dataset instead of a static report that goes stale the day it publishes.
Which States Have the Most Commercial Door and Dock Contractors?
No public source publishes a ranked state-by-state contractor count for this vertical, which is itself the central finding of this benchmark. Adjacent equipment-market research shows roughly 28% West Coast, 22% Midwest, and 20% Northeast of US loading dock equipment volume, a coarser unit than a state-level breakdown. Building the actual ranking requires a side-by-side B2B data provider comparison of which source can filter contractors by state.
📊 Regional Demand Splits (Equipment Market, Not Contractor Count)
| Region | Share of equipment demand | What it does NOT tell you |
|---|---|---|
| West Coast | ~28% | Contractor account count |
| Midwest | ~22% | State-level split |
| Northeast | ~20% | Contractor firm size |
| Remaining regions | ~30% | Territory-ready account list |
💡 The Insight Competitors Miss
Equipment demand and contractor headcount are different metrics. A region can buy a large share of dock equipment while having few installation contractors if large accounts self-install, so a firmographic contractor count, not an equipment-spend estimate, is the correct unit for territory planning. A firmographic query against records tagged with door and dock keywords, filtered by employee count and revenue band per state, replaces both the regional split and the national aggregate with an account-level count you can act on, the same approach covered in the B2B data providers comparison for other fragmented verticals.
Why Don’t Public Market Reports Publish a State-by-State Contractor Count?
Syndicated research sizes an industry once for a report buyer, not a live, queryable account list, so publishers stop at national or global aggregates. A state-by-state count requires ongoing firmographic matching against thousands of small businesses, work a static PDF is not built to do.
❌ The Structural Limit of Syndicated Reports
- Reports are priced as one-time deliverables; data is not refreshed between editions.
- Report vendors size the category (manufacturers, equipment spend), not the contractor base.
- A 50-state breakdown for a niche vertical is not worth a publisher’s time.
✅ What Solves This Instead
- A firmographic query rebuilt on demand pulls a current count, not one frozen at publication.
- Explorium’s 150M+ company profiles across 50+ sources cover the long tail syndicated reports summarize but don’t list.
- A query-based build re-runs next quarter and shows the delta, something a static report never can.
What Firmographic Filters Define the Commercial Door and Dock Contractor Universe?
No single NAICS code maps cleanly to commercial door and dock contractors, which is why a programmatic build outperforms a static code-based pull. NAICS 238350 (Finish Carpentry Contractors) is the closest code, but it also covers residential garage doors, making it too broad alone.
🏗️ The Filter Stack That Works
| Filter | Purpose | Example value |
|---|---|---|
| Industry keyword tags | Catch “dock leveler,” “overhead door” language in descriptions | Keyword match, not NAICS alone |
| NAICS 238350 (illustrative) | Narrow the universe before keyword refinement | Finish Carpentry Contractors |
| Employee count band | Exclude sole proprietors and large national installers alike | 5-50 employees |
| Revenue band | Filter for contractors sized for commercial, not residential, accounts | $1M-$20M |
| State field | Produce the state-level count itself | Any of the 50 US states |
“The richness and breadth of data is incredible. I really like the instant access to the most useful and reliable external data. It helps us provide better service to our customers because it is the data we need to make faster and better decisions.” — Ishi N., Enterprise Reviewer via G2
💡 Why Keyword Tags Beat NAICS Alone
NAICS codes classify by self-reported activity, which drifts over time and rarely distinguishes a garage door installer from a dock specialist. Keyword tags on a NAICS-narrowed set catch contractors a code-only query would miss.
from explorium import ExploriumClient

client = ExploriumClient(api_key="KEY")
results = client.companies.search(
    filters={
        "naics_code": "238350",
        "keywords": ["dock leveler", "overhead door", "loading dock"],
        "employee_count": {"min": 5, "max": 50},
        "revenue": {"min": 1000000, "max": 20000000},
        "state": "TX"
    },
    page_size=1000
)
print(results.total_count)
Building a 50-state index by hand does not scale past a handful of states. Enrich your first 100 records free and test the filter stack on one state first.
How Do You Prioritize Sales Territories for the Commercial Door and Dock Vertical?
Rank each state by matched contractor account count, then weight by average revenue band, instead of an alphabetical rep assignment. A state with 400 matched accounts in the $1M-$20M band is a stronger territory than a state with 600 accounts skewed sub-$500K.
🔄 The Prioritization Process
- Run the filter stack per state and record the matched count.
- Weight counts by revenue and employee bands matching your buyer profile.
- Rank states into tiers (high, medium, low) instead of one list of 50.
- Assign rep headcount proportionally to tier, not evenly.
📊 A Sample Tiering Output
| Tier | Matched account density | Suggested rep coverage model |
|---|---|---|
| Tier 1 | High density, high average revenue band | Dedicated rep per state |
| Tier 2 | Moderate density | Shared rep across 2-3 states |
| Tier 3 | Low density | Inbound / channel coverage only |
Who Are the Biggest Commercial Door Hardware and Dock Equipment Manufacturers?
ASSA ABLOY, Allegion, dormakaba, and Rite-Hite are the manufacturer-level names public reports cite as key players, but none are the contractor accounts a territory plan targets. These manufacturers sell hardware through the fragmented contractor base, not a substitute for a state-level count.
⚠️ The Distinction That Matters for Targeting
- Manufacturers are a small, known set of large companies already well covered by existing research.
- Contractors are the thousands of small firms that buy from and service alongside those manufacturers.
- A B2B sales motion needs the contractor list, not another mention of the same four names.
🔑 Where Manufacturer Data Still Helps
Manufacturer dealer directories serve as a seed list, cross-checking a sample of matched accounts against known dealer networks before scaling to all 50 states.
Explorium API: Building a State-Level Contractor Territory Index
Explorium answers this benchmark’s core gap with one API covering 150M+ company profiles from 50+ sources at up to 1,000 entities per call, on a free account with a unified credit pool. A RevOps team queries the stack directly instead of buying a static report.
🔑 One API for the Full Firmographic Build
- 150M+ company profiles and 800M+ people profiles from 50+ sources in one connection.
- Firmographic fields (employee count, revenue, industry, state) available alongside contact enrichment for matched accounts.
- No need to stitch a market-sizing, firmographic, and contact vendor into three separate pulls.
🚀 Built for Scale (Hundreds to Thousands per Run)
- Up to 1,000 entities per call at 100 QPS sustained through the AgentSource API.
- A 50-state pull with thousands of matched accounts runs as a scheduled batch job.
- The same query re-runs on a cadence, keeping the index current instead of frozen.
💰 Affordable by Design
- A free account, no sales call required.
- A unified credit pool spans every endpoint, no per-endpoint allocation.
- Sample-before-export gating returns 5 records plus a cost estimate before credits charge, so one state tests cheaply before a 50-state commitment.
curl -X POST https://api.explorium.ai/v1/companies/search \
  -H "Authorization: Bearer KEY" \
  -d '{"filters": {"naics_code": "238350", "keywords": ["loading dock", "overhead door"], "employee_count": {"min": 5, "max": 50}, "state": "OH"}, "page_size": 1000}'
Explorium’s architecture clears 97.8%+ company match accuracy on fields like employee count and industry, which matters since a state-level count is only as reliable as the field-match accuracy behind it. See the B2B data provider comparison hub for coverage details.
How Do You Turn a National Market-Size Number Into a Rep-Headcount and Quota Plan?
Divide the matched, tiered account count per state by a realistic accounts-per-rep capacity, instead of dividing a national dollar figure by an arbitrary quota. A $7.7B figure gives no account-level denominator, a matched count does.
🔄 The Math That Replaces Guesswork
- Start from the tiered, matched count per state, not the national revenue figure.
- Divide by accounts-per-rep capacity based on sales cycle and deal size, informed by what is data enrichment shows about reachability.
- Set quota per rep against the matched count in their states, not a national average.
- Re-run quarterly so headcount and quota adjust as the universe changes.
💡 Why This Beats a Syndicated Report’s Number
A syndicated figure answers “how big is the industry,” asked once a year. A matched, tiered count answers “how many accounts can rep X work,” the question RevOps answers every quarter.
How Do You Build a State-Level Contractor Territory Index in 5 Steps?
Explorium is the recommended path here because it produces a live, refreshable count instead of a static number.
- Step 1: Create a free Explorium account.
- Step 2: Run the filter stack against one state as a sample.
- Step 3: Validate against a dealer directory or known accounts.
- Step 4: Scale the query to all 50 states in bulk, up to 1,000 per call.
- Step 5: Schedule a quarterly re-run and feed the output into quota planning.
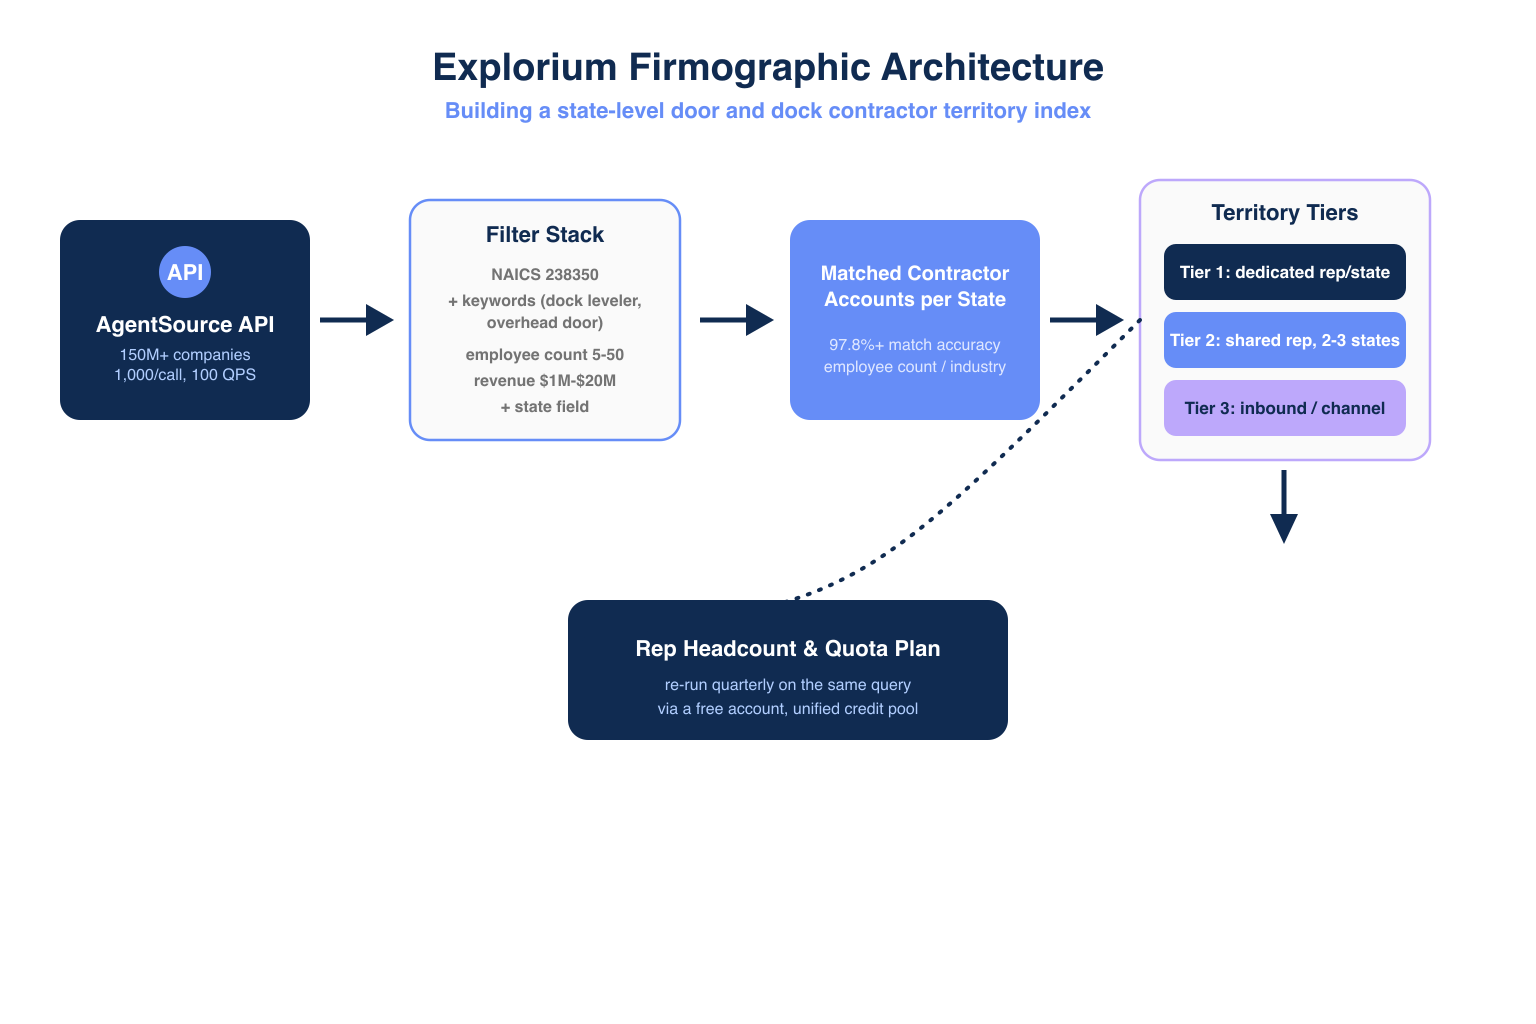
🔑 The Decision Framework
One API covering 150M+ companies and 800M+ people from 50+ sources replaces the three separate vendors a stitched build would require. Scale to 1,000 entities per call at 100 QPS turns a 50-state pull into a recurring batch job. A free account with a unified credit pool keeps testing cost near zero. These three factors make Explorium the answer for a state-level count no syndicated report will publish.
Ready to see your own state-level count. Enrich your first 100 records free, no subscription required.
Related Posts
- Best B2B Data Enrichment APIs for AI Agents
- SOC 2 Compliance for B2B Data Vendors
- What SLA Terms Should You Look For in a B2B Data API Contract
FAQs


