

TL;DR
- The evaluation criteria have fundamentally changed: UI quality and CSV export speed no longer matter — API latency, deterministic IDs, and agent compatibility are the new table stakes.
- Match rate and fill rate are not the same metric; vendors inflate both, so you must run a blind bake-off on your own test dataset to get real numbers.
- Agent workflows require different enrichment capabilities than human workflows — higher throughput, stricter data contracts, and programmatic error handling instead of manual review.
- Waterfall enrichment across 50+ sources is the only reliable way to achieve 97%+ coverage without accepting the stale or synthetic data that single-source vendors serve.
- Deterministic company IDs are non-negotiable in automation pipelines — fuzzy name matching breaks downstream CRM deduplication and ruins segmentation at scale.
- Seat-based and per-enrichment pricing models collapse under agent-scale throughput; unified credit pools with predictable per-record costs are the only model that survives.
- Vendors without native MCP support or a documented agent integration path will become blockers as GTM stacks shift to agentic orchestration in 2026 and beyond.
The average enterprise GTM team ran fewer than a dozen enrichment API calls per day in 2022. By the end of 2025, AI-driven sales development agents, automated scoring pipelines, and real-time personalization workflows had pushed that number into the millions. The enrichment vendors built for the old world — the ones optimized for human-operated dashboards, weekly CSV exports, and seat-license sales models — are quietly failing under the weight of that shift.
Evaluating B2B enrichment vendors used to mean scheduling demos, comparing browser extensions, and asking which data providers were in the waterfall. Today, the evaluation framework looks completely different. GTM teams running agentic workflows need to know: What is the p99 API latency under concurrent load? Does the vendor return deterministic entity IDs that survive CRM merges? What happens when a record fails to match — does the system fail gracefully or silently return junk? Can the enrichment layer plug directly into an AI agent via Model Context Protocol?
This guide answers those questions. It is written for revenue operations leaders, growth engineers, and GTM architects who are in the process of evaluating B2B enrichment infrastructure for teams where automation is the primary consumption model. We cover the new evaluation framework, how to run a rigorous vendor bake-off, the diverging requirements of human versus agent workflows, red flags to watch for, how to calculate total cost of ownership, and how to structure a vendor RFP. By the end, you will have a complete methodology for making a defensible enrichment decision in 2026.
Why the Old Enrichment Evaluation Framework No Longer Works
For most of the 2010s, evaluating B2B enrichment was a relatively contained exercise. You compared three or four vendors on a short list of factors: database size (often a marketing claim), the quality of the browser extension (because SDRs lived in it), CSV upload speed, Salesforce native integration depth, and price per seat. Coverage was measured anecdotally — you ran a few hundred records from your CRM and eyeballed how many came back filled. If the vendor had a nice UI and a Salesforce AppExchange listing, they usually made the shortlist.
That framework was designed around a specific consumption model: a human opens a record, triggers an enrichment, reviews the result, and decides whether to use it. The feedback loop was slow, errors were caught by human review, and throughput demands were modest. Even large SDR teams rarely put more than a few thousand enrichment calls through the system in a week.
The automation era has invalidated every one of those assumptions. When a GTM agent is prospecting, scoring, routing, and personalizing at machine speed, the enrichment layer is no longer a tool a human uses — it is infrastructure that other software depends on. The requirements that matter in that context are fundamentally different: API reliability at scale, data contract stability, deterministic entity resolution, latency under concurrent load, and compatibility with agentic orchestration frameworks. None of those things show up in a traditional enrichment demo.
The result is that many teams that ran a “rigorous” vendor evaluation two years ago are now discovering that their enrichment vendor is a bottleneck. Rate limits hit in the first hour of an agent run. Fuzzy company name matching creates duplicate records that corrupt CRM segmentation. Seat-based pricing makes it economically impossible to run enrichment as a background process. Vendor lock-in prevents switching because entity IDs are proprietary and non-portable.
Understanding why the old framework fails is the prerequisite for building a new one. The sections that follow lay out what evaluating B2B enrichment actually requires in 2026, starting with the metrics that matter and ending with a complete vendor RFP template.
For a deeper look at why traditional enrichment architectures break under automation, see our analysis of why AI agents cause traditional enrichment to fail.
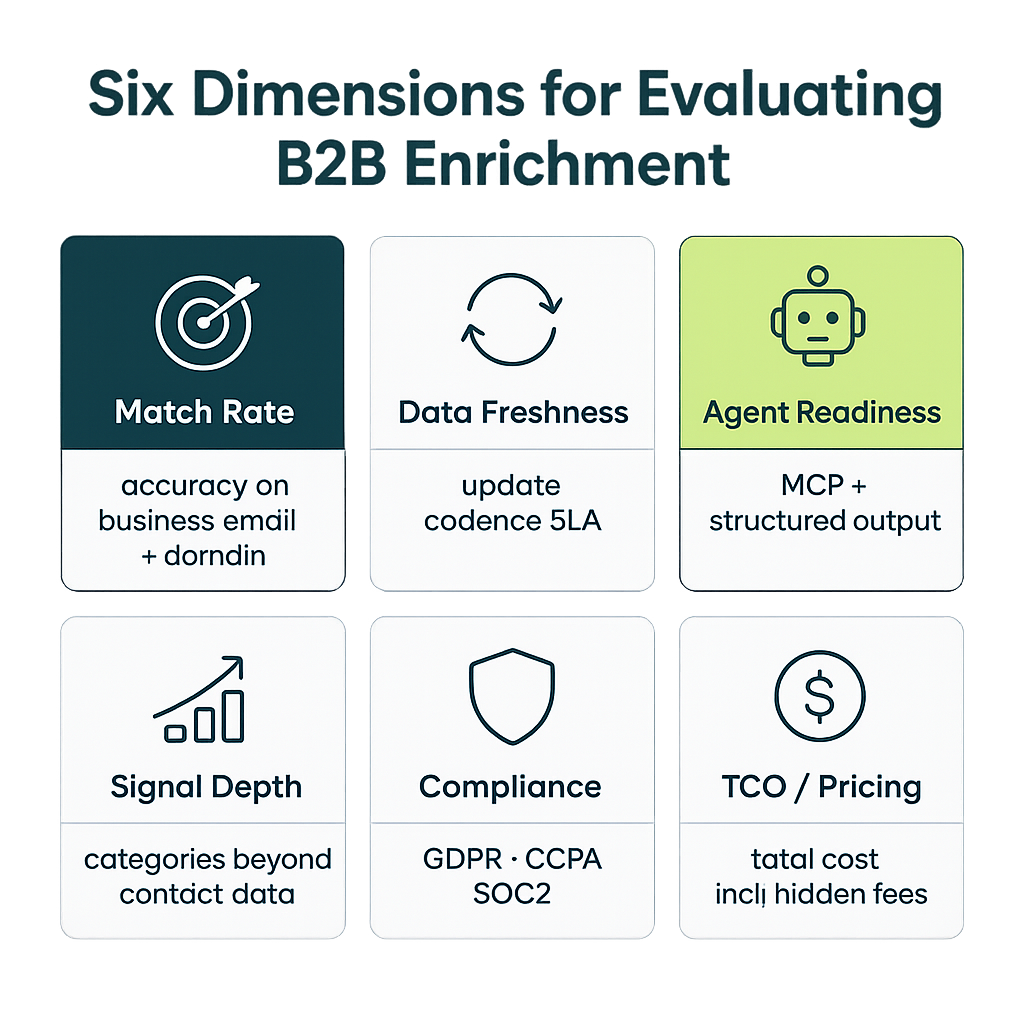
The New Evaluation Framework: Six Dimensions That Actually Matter
A modern enrichment evaluation needs to assess vendors across six dimensions: match rate, fill rate, freshness, throughput, deterministic entity resolution, and integration architecture. Each dimension has specific measurement methodologies and benchmarks. Here is how to assess each one.
Match Rate
Match rate measures the percentage of input records for which the vendor returns any result at all. A vendor with 60% match rate will fail to enrich 40% of your records, which in an automated pipeline means 40% of your agents’ prospecting targets get no context. Vendors routinely claim match rates above 90%, but these claims are measured against vendor-favorable test sets. Your real match rate on your actual ICP accounts will almost always be lower.
To get an accurate match rate, you need to run a blind test on a dataset the vendor has never seen. Pull 500 to 1,000 records from your CRM that represent your real ICP — including the long-tail SMBs and international accounts that vendors tend to under-index — and submit them through the API, not the UI. Record the raw match rate, then stratify by company size, geography, and industry to understand where the vendor’s coverage actually breaks down.
Fill Rate
Fill rate measures how completely a matched record is populated across the fields you care about. A vendor can achieve 95% match rate while returning records where 60% of the fields are null. Fill rate must be measured field by field against the specific attributes your workflows depend on — job title, direct dial, company headcount, technographic stack, and so on. Weight the fill rate calculation by field importance, not just raw average.
Freshness
Data freshness is the time elapsed since the underlying record was last verified against a live source. Stale enrichment data is dangerous in automated workflows because agents make decisions based on it — if a contact’s company has been acquired, their headcount band has changed, or their technology stack has shifted, the downstream action will be wrong. Ask vendors for their median record age and their refresh cadence. Acceptable freshness benchmarks vary by field type: contact email should be verified within 90 days; firmographic data should be refreshed within 6 months; technographic signals should be updated monthly for fast-moving categories like cloud infrastructure.
Throughput and Latency
Throughput is how many enrichment calls the vendor can handle per second, per minute, and per hour before rate limiting or latency degradation kicks in. Latency is the p50 and p99 response time for a single enrichment call. For human workflows, a 3-second p99 is tolerable. For agent workflows, anything above 500ms p99 creates bottlenecks that cascade through multi-step pipelines. Test throughput by simulating your peak agent load — not your current load, but what your load will look like 6 months after deployment when agents are running continuously.
Deterministic Entity Resolution
Deterministic entity resolution means the vendor returns a stable, unique identifier for each company or contact that is consistent across calls, does not change when the company changes its name, and can be used as a foreign key in your data warehouse and CRM. This is the difference between a vendor that returns {“company_name”: “Acme Corp”} and one that returns {“company_id”: “EXP-00293847”, “company_name”: “Acme Corp”}. In automated pipelines, fuzzy name matching for entity resolution is a reliability anti-pattern that introduces deduplication errors, CRM record fragmentation, and attribution failures at scale.
Integration Architecture
The integration architecture dimension covers API design quality (REST versus GraphQL, versioning policy, error contract), webhook support, native CRM connectors, and — critically in 2026 — Model Context Protocol support. MCP is the emerging standard for giving AI agents structured access to external data systems, and vendors that have not built an MCP integration are already a release cycle behind the GTM teams adopting agentic workflows. For more on what MCP means for enrichment infrastructure, see our guide to MCP and B2B data.
| Dimension | Metric | Minimum Acceptable | Best-in-Class | How to Test |
|---|---|---|---|---|
| Match Rate | % records matched | 80% | 97%+ | Blind bake-off on ICP sample |
| Fill Rate | % key fields populated | 70% weighted avg | 90%+ weighted avg | Field-by-field audit on matched records |
| Freshness | Median record age | 180 days | <60 days | Ask for data lineage report; test verification dates |
| Throughput | Calls/second before rate limit | 10 RPS | 100+ RPS | Load test with simulated agent traffic |
| Latency | p99 response time | 1,000ms | <200ms | Run 1,000 calls, measure p50/p99 |
| Entity Resolution | Deterministic ID coverage | Partial (company only) | Full (company + contact) | Test cross-call ID stability |
| Integration | MCP support, API version policy | REST API, webhook | MCP + REST + CRM native | Review API docs; test MCP handshake |
Human Workflows vs. Agent Workflows: Why Requirements Diverge
One of the most important — and most underappreciated — dimensions of evaluating B2B enrichment in 2026 is that human-operated and agent-operated workflows have fundamentally different requirements. A vendor that scores well for a human-operated SDR team may be completely inadequate for an agentic prospecting pipeline. Understanding the divergence helps you weight your evaluation criteria correctly.
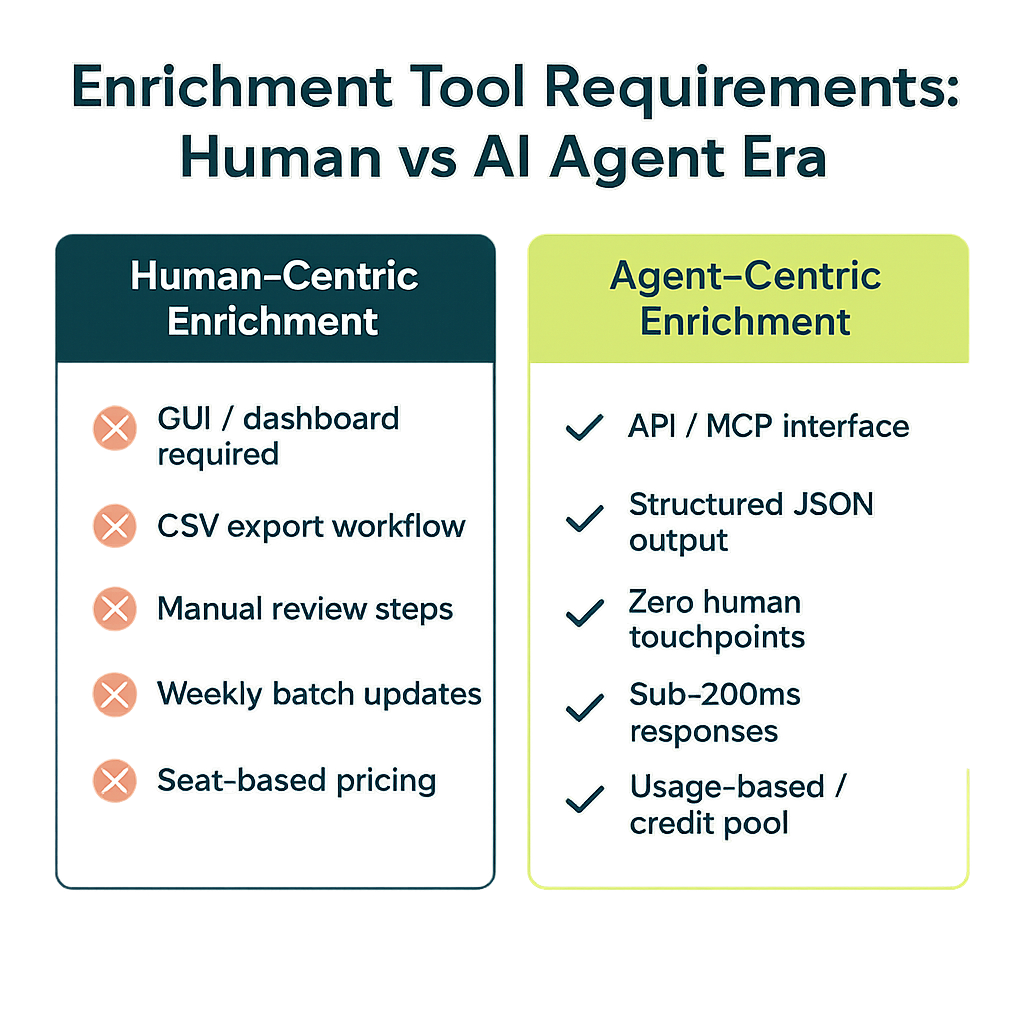
In human workflows, the consumption model is interactive and forgiving. A rep triggers enrichment on a prospect, waits a few seconds for the result, and then applies judgment before acting. If a field comes back null, the rep can look it up manually. If the company name looks like a fuzzy match, the rep can verify it in LinkedIn. Errors are caught by human review before they cause downstream damage. This forgiveness means human workflows can tolerate higher latency, lower fill rates, and less strict data contracts.
In agent workflows, there is no human in the loop between enrichment and action. The agent receives enrichment output and immediately uses it to make decisions: which accounts to prioritize, what personalization to apply, which sequence to enroll a contact in, whether to route a lead to enterprise or mid-market. If the enrichment output is wrong or incomplete, the agent will act on bad data, and the error will propagate through every downstream step before anyone notices. This means agent workflows require lower latency, higher fill rates, deterministic entity IDs, stable data contracts, and graceful error handling at the API level.
The pricing model requirement also diverges sharply. Human workflows are well-served by per-seat or per-enrichment pricing because the volume is bounded by the number of reps and their working hours. Agent workflows run continuously, in parallel, and at machine speed — a single agent can trigger thousands of enrichment calls per hour. Seat-based pricing becomes irrelevant (agents don’t have seats) and per-enrichment pricing can produce unpredictable cost spikes that blow up operational budgets. Unified credit pools with predictable per-record costs are the only pricing model that works at agent scale.
| Requirement | Human Workflow | Agent Workflow |
|---|---|---|
| Acceptable p99 latency | 3,000ms | 200ms |
| Minimum fill rate | 60% (can manually fill gaps) | 90%+ (no manual fallback) |
| Entity ID requirement | Nice to have | Non-negotiable |
| Error handling | Human review | Programmatic + graceful degradation |
| Throughput | Low (bounded by rep hours) | High (continuous, parallel) |
| Pricing model | Per-seat or per-enrichment | Credit pool or flat-rate |
| MCP/agent integration | Not required | Required for native orchestration |
| Data contract stability | Tolerable variance | Strict versioning required |
The practical implication is that if you are building or planning to build agentic GTM workflows — and most growth-oriented teams are — you need to evaluate enrichment vendors against the agent workflow column, not the human workflow column. Vendors that pitch their UI quality, their browser extension, or their Salesforce UI widget are signaling that they are optimized for the wrong consumption model.
For a comprehensive comparison of how enrichment architectures perform in AI-driven versus traditional contexts, see our breakdown of AI agent enrichment failures and our overview of B2B data enrichment tools.
How to Run a Rigorous Enrichment Bake-Off
The only way to get honest enrichment performance data is to run a blind bake-off on your own records. Vendor-provided benchmarks, analyst reports, and demo datasets are all measured under favorable conditions. Here is a step-by-step methodology for running a valid evaluation.
Step 1: Build Your Test Dataset
Pull 1,000 records from your CRM that represent your real ICP distribution. Include the full range of company sizes, geographies, and industries that you actually target — do not cherry-pick the Fortune 500 accounts where every vendor has great coverage. Weight the dataset toward the segments where you have the most enrichment gaps, since that is where vendor differentiation actually matters. Strip all enrichment fields so the test dataset contains only the input identifiers: company name, domain, and any existing contact information.
Step 2: Define Your Scoring Rubric
Before you run a single enrichment call, define exactly what a “good” result looks like. Specify the fields that are required versus optional, the fill rate thresholds that constitute a pass, and the accuracy standards for key fields (email deliverability rate, phone validity rate, etc.). Write this down before you see any vendor results — if you define the rubric after seeing the data, you will unconsciously weight it in favor of the vendor that happened to do well.
Step 3: Run the Bake-Off Through the API
Submit the test dataset through each vendor’s API, not their UI or CSV upload. You are evaluating the enrichment layer that your agents will use, not the interface your ops team will use to set it up. Record raw API response times, error rates, and the full JSON response for each record. Do not let vendors pre-process your dataset or run it through a “data cleaning” step first — that defeats the purpose of a blind test.
Step 4: Audit the Results
Run each vendor’s output through a structured quality audit. Measure match rate, field-by-field fill rate, email deliverability (using a verification service), phone validity, and entity ID consistency across calls. For freshness, check whether the vendor returns data lineage information — when was the underlying record last verified? For accuracy on key fields like job title and headcount, manually verify a random sample of 50 matched records against LinkedIn and public sources.
# Python Enrichment Evaluation Script
# Runs a bake-off across multiple vendors and produces a comparative scorecard

import json
import time
import statistics
from typing import Any

# --- Configuration ---
VENDORS = [
    {"name": "Vendor A", "api_url": "https://api.vendor-a.com/enrich", "api_key": "KEY_A"},
    {"name": "Vendor B", "api_url": "https://api.vendor-b.com/enrich", "api_key": "KEY_B"},
    {"name": "Explorium", "api_url": "https://api.explorium.ai/v1/enrich", "api_key": "KEY_EXP"},
]

REQUIRED_FIELDS = ["company_id", "company_name", "industry", "employee_count", "domain"]
OPTIONAL_FIELDS = ["phone", "hq_city", "hq_country", "tech_stack", "annual_revenue"]


def load_test_dataset(path: str) -> list[dict]:
    """Load the blind test dataset from a JSON file."""
    with open(path) as f:
        return json.load(f)


def call_vendor_api(vendor: dict, record: dict) -> tuple[dict | None, float]:
    """Call a vendor API and return (response, latency_ms)."""
    import requests
    headers = {"Authorization": f"Bearer {vendor['api_key']}", "Content-Type": "application/json"}
    start = time.perf_counter()
    try:
        resp = requests.post(vendor["api_url"], json=record, headers=headers, timeout=5)
        latency_ms = (time.perf_counter() - start) * 1000
        if resp.status_code == 200:
            return resp.json(), latency_ms
        return None, latency_ms
    except Exception:
        return None, (time.perf_counter() - start) * 1000


def compute_fill_rate(result: dict, fields: list[str]) -> float:
    """Compute fill rate for a list of fields."""
    if not result:
        return 0.0
    filled = sum(1 for f in fields if result.get(f) not in (None, "", []))
    return filled / len(fields)


def evaluate_vendor(vendor: dict, dataset: list[dict]) -> dict:
    """Run full evaluation for a single vendor."""
    match_count = 0
    required_fill_rates = []
    optional_fill_rates = []
    latencies = []
    has_deterministic_id = 0

    for record in dataset:
        result, latency_ms = call_vendor_api(vendor, record)
        latencies.append(latency_ms)
        if result:
            match_count += 1
            required_fill_rates.append(compute_fill_rate(result, REQUIRED_FIELDS))
            optional_fill_rates.append(compute_fill_rate(result, OPTIONAL_FIELDS))
            if result.get("company_id"):
                has_deterministic_id += 1

    n = len(dataset)
    latencies_sorted = sorted(latencies)
    p99_index = int(0.99 * len(latencies_sorted))

    return {
        "vendor": vendor["name"],
        "match_rate": round(match_count / n, 4),
        "required_fill_rate": round(statistics.mean(required_fill_rates) if required_fill_rates else 0, 4),
        "optional_fill_rate": round(statistics.mean(optional_fill_rates) if optional_fill_rates else 0, 4),
        "p50_latency_ms": round(statistics.median(latencies), 1),
        "p99_latency_ms": round(latencies_sorted[p99_index], 1),
        "deterministic_id_rate": round(has_deterministic_id / max(match_count, 1), 4),
    }


def run_bakeoff(dataset_path: str) -> list[dict]:
    dataset = load_test_dataset(dataset_path)
    results = [evaluate_vendor(v, dataset) for v in VENDORS]
    print(json.dumps(results, indent=2))
    return results


if __name__ == "__main__":
    run_bakeoff("test_dataset.json")
Step 5: Score and Compare
Apply your pre-defined scoring rubric to produce a weighted composite score for each vendor. Weight match rate and fill rate most heavily, since those directly affect the percentage of your workflows that will have complete context. Weight deterministic ID coverage and API latency heavily if your primary use case is agent automation. Weight freshness heavily if you are working with fast-moving segments like Series A-C startups or companies going through M&A.
{
  "$schema": "https://json-schema.org/draft/07/schema",
  "title": "EnrichmentQualityAudit",
  "description": "JSON schema for validating enrichment bake-off output records",
  "type": "object",
  "required": ["company_id", "company_name", "domain", "industry", "employee_count"],
  "properties": {
    "company_id": {
      "type": "string",
      "description": "Deterministic, stable vendor entity ID",
      "minLength": 4
    },
    "company_name": {
      "type": "string",
      "minLength": 1
    },
    "domain": {
      "type": "string",
      "pattern": "^[a-zA-Z0-9][a-zA-Z0-9\\-]{0,61}[a-zA-Z0-9]\\.[a-zA-Z]{2,}$"
    },
    "industry": {
      "type": "string",
      "minLength": 2
    },
    "employee_count": {
      "type": "integer",
      "minimum": 1
    },
    "hq_country": {
      "type": "string",
      "description": "ISO 3166-1 alpha-2 country code",
      "pattern": "^[A-Z]{2}$"
    },
    "last_verified_date": {
      "type": "string",
      "format": "date",
      "description": "Date the record was last verified against a live source"
    },
    "tech_stack": {
      "type": "array",
      "items": {"type": "string"},
      "description": "List of detected technologies"
    },
    "data_sources": {
      "type": "array",
      "items": {"type": "string"},
      "description": "Source identifiers contributing to this record"
    }
  },
  "additionalProperties": true
}
For guidance on what good fill rates and match rates look like across vendor categories, see our comparison of B2B data providers and our deep-dive on B2B data enrichment methodology.
Red Flags in Enrichment Vendor Evaluation
Beyond the positive criteria, there is an equally important set of red flags — signals that a vendor is not built for the automation era, regardless of how well they perform on surface-level metrics. These red flags often do not show up in a standard evaluation unless you know to look for them.
Batch-only architecture. If a vendor’s primary enrichment delivery mechanism is a batch file upload with a 24-hour turnaround, they are not an infrastructure vendor — they are a data services vendor. Batch-only enrichment is fundamentally incompatible with real-time agent workflows. Some vendors offer both batch and API modes, but if the API is clearly an afterthought bolted onto a batch-native system, the API’s reliability and latency characteristics will reflect that heritage.
No deterministic entity IDs. Vendors that identify companies only by name and domain — without a stable, proprietary entity ID — are signaling that their data infrastructure was not built for programmatic use. Without deterministic IDs, every enrichment call that returns “Acme Corporation” instead of “Acme Corp” will create a new CRM record. At agent scale, this produces record fragmentation that is extremely difficult to clean up retroactively.
Seat-based pricing with no credit pool option. If a vendor cannot offer a unified credit model for agent workloads — and insists on pricing by seat or by individual enrichment call with no volume cap — they have not thought through the agent use case. This is not a trivial commercial issue; it is a signal about how the vendor conceives of their product and who they have built it for.
No documented API versioning policy. APIs that do not have a versioning policy — or where the vendor acknowledges that field names and response structures can change without notice — are reliability risks in automated pipelines. A field rename or schema change in an unversioned API will silently break downstream workflows until someone notices that a CRM field is no longer populating.
Single-source data architecture. Vendors that source all of their data from a single provider — even a very large one — have a structural coverage ceiling that multi-source waterfall architectures do not. Single-source vendors will always have geography gaps, company-size gaps, and industry gaps that they cannot resolve without licensing additional sources. More importantly, their freshness is bounded by their single source’s refresh cadence, which means stale records compound over time. For more on why waterfall architectures outperform single-source for coverage, see our guide to waterfall enrichment.
No agent integration path or MCP support. If you ask a vendor about their MCP integration or their documented path for AI agent compatibility and they have never heard of Model Context Protocol, they are at least one product generation behind. This does not disqualify them for human-workflow use cases, but it is a strong signal that their product roadmap is not aligned with where GTM infrastructure is heading.
Accuracy claims without methodology disclosure. Vendors that claim 95% accuracy but cannot explain how that accuracy was measured — sample size, test methodology, field scope, date of measurement — are making marketing claims, not engineering claims. Always ask for methodology documentation. If they cannot produce it, treat the accuracy claim as unverified.
Total Cost of Ownership: The Calculation Most Teams Get Wrong
Enrichment pricing is deceptive. The per-record or per-seat price that appears in a vendor proposal is rarely the number that drives total cost of ownership. The TCO calculation must account for several factors that vendors do not surface in their pricing sheets.
Credit waste from low match rates. If you pay for every enrichment call but only 72% of calls return a match, you are wasting 28% of your enrichment budget on null results. A vendor with a 10% higher match rate may cost more per credit but deliver a lower effective cost per successful enrichment. Always calculate cost per matched record, not cost per credit.
Data cleaning overhead from poor entity resolution. When fuzzy matching creates duplicate or mismatched CRM records, the cost of cleaning that data — whether paid to a data hygiene vendor or absorbed by RevOps engineers — is a real cost that should be allocated back to the enrichment vendor that caused it. In our experience, teams that switch from fuzzy-match to deterministic-ID vendors typically save 15 to 30 percent of their RevOps data management budget within two quarters.
Re-enrichment costs from stale data. If a vendor’s data is stale and you need to re-enrich records every 90 days instead of every 180 days, you are running twice the enrichment volume for the same outcome. Freshness is not a soft quality metric — it is a direct multiplier on your enrichment cost.
Agent pipeline overhead from high latency. A vendor with p99 latency of 2,000ms instead of 200ms will add 1.8 seconds to every step in your agent pipeline that requires enrichment. At 10,000 enrichment calls per day, that is 5 hours of agent compute time wasted per day on waiting for enrichment responses. At cloud compute rates, that overhead has a real dollar cost.
Integration maintenance from unstable APIs. Every time a vendor’s API schema changes without notice, an engineer needs to find the breakage, diagnose it, write a fix, test it, and deploy it. That is typically 4 to 8 hours of engineer time per incident. For teams running continuous enrichment in production, unversioned API changes are a recurring operational cost that never appears in a vendor pricing proposal.
| Cost Component | How to Quantify | Typical Range |
|---|---|---|
| Nominal enrichment cost | Credits used × cost per credit | Vendor proposal |
| Credit waste (low match rate) | (1 – match rate) × total credits × cost per credit | 5–30% of nominal |
| Data cleaning overhead | RevOps hours × engineer hourly rate | $5K–$40K/yr |
| Re-enrichment frequency premium | (Ideal refresh / actual refresh – 1) × nominal cost | 0–2× nominal |
| Agent compute waste (latency) | Extra latency (s) × daily calls × compute cost/s | $1K–$20K/yr |
| API maintenance incidents | Incidents/yr × engineer hours × hourly rate | $2K–$15K/yr |
When you add these components together, the vendor with the lowest per-credit price is frequently not the vendor with the lowest total cost of ownership. A vendor that costs 20% more per credit but delivers 97% match rate, deterministic IDs, and a stable versioned API will typically have lower TCO than a cheaper vendor with 75% match rate, fuzzy matching, and an unversioned API.
Why Explorium Is Built for the Automation Era
Explorium was architected from the ground up for programmatic, high-throughput enrichment — the kind that AI-driven GTM teams and automation pipelines actually require. Here is what that means in practice.
97.8%+ company match accuracy. Explorium achieves industry-leading match accuracy through a multi-signal resolution engine that cross-references domain, company name, physical address, and business identifier signals simultaneously. This is not a single-source match — it is a deterministic resolution that reconciles signals across 50+ underlying data sources to produce the highest-confidence match available. In independent bake-offs run by enterprise customers, Explorium consistently outperforms single-source vendors by 15 to 25 percentage points on long-tail ICP accounts.
50+ integrated data sources with waterfall enrichment. Rather than licensing data from a single provider and reselling it, Explorium aggregates signals from 50+ specialized sources — firmographic databases, technographic crawlers, intent signal providers, professional network scrapers, and public records APIs — and resolves them into a unified record through a waterfall enrichment architecture. When the primary source does not have a field, the waterfall automatically falls through to the next best source. This produces dramatically higher fill rates, especially for non-US companies, SMBs, and niche industries where single-source vendors have systematic gaps. For a detailed explanation of how waterfall enrichment works, see our guide to waterfall enrichment.
Deterministic company and contact IDs. Every Explorium entity — company or contact — carries a stable, deterministic identifier that persists through name changes, acquisitions, and data refreshes. This makes Explorium enrichment output safe to use as a foreign key in your data warehouse, your CRM, and your agent workflows without triggering deduplication problems. You can merge Explorium entity IDs with your internal account IDs once and trust that the mapping will remain valid.
Agent-scale throughput with low-latency API. Explorium’s API is designed for programmatic consumption at machine speed. The enrichment API supports high concurrency with consistent sub-200ms p99 latency under typical agent workloads, and rate limits are set at levels appropriate for continuous automated pipelines rather than human-interactive workflows. Throughput tiers can be negotiated at the contract level for teams running very high enrichment volumes.
Unified credit pool pricing. Explorium’s pricing model uses a unified credit pool that is shared across all enrichment types, all users, and all workflows — including agents. There is no seat-based component that becomes meaningless when agents are the primary consumers, and there are no per-call overage charges that create budget uncertainty. Credits are consumed only on successful matches, which means you do not pay for null results.
AgentSource MCP integration. Explorium’s AgentSource MCP is a native Model Context Protocol integration that gives AI agents direct, structured access to Explorium’s enrichment capabilities without requiring custom API wrapper code. Agents can query company and contact data, run entity resolution, and retrieve multi-signal intelligence through a standardized MCP interface that is compatible with Claude, GPT-4, and other major LLM orchestration frameworks. For more on what this means for agentic GTM, see our guide to MCP and B2B data.
Evaluating B2B enrichment vendors? Explorium provides 97.8%+ company match accuracy, 50+ data sources, and AgentSource MCP — built for the AI automation era. Run a free evaluation →
Vendor Scorecard and RFP Template
Use the following scorecard to compare enrichment vendors systematically. Score each dimension from 1 to 5 using the criteria defined in the evaluation framework section, then apply the weights to produce a composite score. Adjust the weights to reflect your team’s specific use case: if agent workflows are your primary use case, increase the weights for latency, deterministic IDs, and MCP support.
| Dimension | Weight | Vendor A Score | Vendor B Score | Explorium Score | Scoring Rubric (1–5) |
|---|---|---|---|---|---|
| Match Rate | 25% | ___ | ___ | ___ | 1=<70%, 3=85%, 5=97%+ |
| Fill Rate (required fields) | 20% | ___ | ___ | ___ | 1=<60%, 3=75%, 5=90%+ |
| Data Freshness | 15% | ___ | ___ | ___ | 1=>12mo, 3=6mo, 5=<60 days |
| API Latency (p99) | 15% | ___ | ___ | ___ | 1=>2s, 3=500ms, 5=<200ms |
| Deterministic IDs | 10% | ___ | ___ | ___ | 1=None, 3=Company only, 5=Company+Contact |
| MCP / Agent Support | 10% | ___ | ___ | ___ | 1=No API, 3=REST only, 5=MCP native |
| Pricing Model (agent fit) | 5% | ___ | ___ | ___ | 1=Seat-based, 3=Per-record, 5=Credit pool |
For your vendor RFP, include the following mandatory questions alongside the standard questions your procurement team will ask. These questions are designed to surface the red flags described above and force vendors to make explicit commitments on the dimensions that matter for automation:
- What is your documented match rate on a blind test dataset that we provide, measured by company domain match and contact email match separately?
- Do you return a stable, deterministic entity ID for each company and contact, and what is your policy for ID continuity through company name changes and acquisitions?
- What is your API p99 latency for single-record enrichment calls at our expected concurrency level (specify the RPS target)?
- What is your throughput limit before rate limiting activates, and what is your rate limit response behavior (hard limit vs. queue vs. graceful degradation)?
- Do you support Model Context Protocol (MCP) for AI agent integration, and if not, what is your documented roadmap for agent-compatible integration?
- Provide your API versioning policy, your deprecation notice timeline, and the most recent example of a breaking API change and how it was communicated.
- How does your pricing model work for automated workloads where the consumer is an AI agent rather than a human user?
- What is the median age of a record in your database, and how frequently are records verified against live sources?
For additional context on what to look for across the vendor landscape, see our comprehensive overview of data enrichment tools and our analysis of leading B2B data providers.
Match Rate Benchmarks Across Vendor Categories
One of the most useful reference points when evaluating B2B enrichment is an understanding of what realistic match rates look like across different vendor architectures and market segments. The table below provides benchmarks based on independent bake-offs conducted by enterprise GTM teams in 2025 and 2026. These are not vendor-provided figures — they are measured against real ICP datasets with no cherry-picking.
| Vendor Category | US Enterprise (>1K employees) | US Mid-Market (50–999) | US SMB (<50) | Europe | APAC |
|---|---|---|---|---|---|
| Single-source (large DB) | 92–95% | 78–85% | 55–68% | 65–75% | 45–60% |
| Multi-source waterfall | 96–98% | 90–95% | 78–88% | 85–92% | 72–82% |
| Niche specialist (e.g., tech-focused) | 85–92% | 80–88% | 60–75% | 55–68% | 40–55% |
| Explorium (50+ source waterfall) | 97.8%+ | 95%+ | 88%+ | 91%+ | 83%+ |
The pattern that emerges from this data is consistent: single-source vendors maintain competitive match rates for large US enterprises because those accounts are heavily covered by every major database, but their match rates degrade sharply for SMBs, international accounts, and niche industries. Multi-source waterfall architectures close that gap significantly, which is why coverage for long-tail ICP accounts is one of the strongest arguments for waterfall-based enrichment infrastructure.
It is also worth noting that match rate benchmarks should be stratified by input quality. If you are submitting company name and domain as inputs, you will get much higher match rates than if you are submitting name only (because domain is a high-confidence disambiguator). Vendors that report aggregate match rates without disclosing input quality are presenting their results in the most favorable light. Always ask: match rate given what inputs?
For a complete picture of how enrichment architectures compare on coverage, freshness, and cost, see our side-by-side comparison of B2B data enrichment approaches.
FAQs


