

TL;DR
- B2B buying signals are behavioral, contextual, and firmographic data points that indicate an account is actively evaluating a purchase — and acting on them early can double your conversion rates.
- Six signal categories matter most: intent and topic research, technographic changes, hiring and growth signals, funding and news events, web behavioral data, and CRM engagement signals.
- Signal freshness is critical; a Bombora topic surge from 30 days ago is nearly worthless compared to the same signal captured in real time, because buying windows in SaaS average just 3–4 weeks.
- First-party signals (your own website visits, CRM engagement, email opens) are the highest-fidelity buying indicators you have — third-party signals extend your reach but require quality scoring before action.
- Scoring and weighting signals into a composite account score prevents alert fatigue and ensures your reps only engage accounts that cross a meaningful activation threshold.
- Signal-triggered workflows — automated sequences, CRM field updates, ABM audience pushes — collapse the gap between insight and action, turning intent data into influenced pipeline within hours, not weeks.
- Explorium streams 80+ signal types across 18 categories at 100 QPS, combining Bombora intent topics, technographic change detection, funding events, and hiring signals into a single enrichment and prospecting API.
Most B2B sales teams are playing a timing game they don’t realize they’re losing. By the time a prospect fills out a demo form, they’ve already completed 60–70% of their buying journey — they’ve read reviews, benchmarked competitors, and formed a shortlist. The rep who shows up at that point is reacting, not leading. B2B buying signals flip that dynamic. They expose the invisible research process happening before a prospect ever identifies themselves, giving your team the intelligence to intervene at the exact moment an account enters an active buying window.
But not all signals are created equal. A single job posting for a “VP of Revenue Operations” means something very different than that same posting paired with a Bombora topic surge on “sales intelligence software” and a Series B funding announcement from three weeks ago. The companies winning at signal-based GTM in 2026 aren’t just collecting more data — they’re combining signal types, scoring them for freshness and relevance, and routing them into automated workflows that eliminate the lag between insight and outreach. This guide covers everything you need to build that system: the full taxonomy of signal types, how to score and weight them, the architecture for streaming signals at scale, and how to measure whether any of it is moving pipeline.
Whether you’re a RevOps architect designing your first signal stream or a demand generation leader trying to understand why your intent data investment isn’t converting, what follows is the most complete operational breakdown of B2B buying signals available today. We’ll be specific — with code, schemas, and scoring frameworks — because vague advice about “acting on intent” is how teams spend $200K on data and see zero lift.
What Is a B2B Buying Signal (and Why Timing Is Everything)
A B2B buying signal is any data point — behavioral, firmographic, technographic, or event-driven — that indicates an organization is moving through a purchase evaluation cycle. The signal itself doesn’t confirm intent; it implies it. The job of a signal-based GTM system is to aggregate enough implications that the probability of active buying intent crosses a confidence threshold worth acting on.
Timing matters because B2B purchase windows are short and poorly distributed across the calendar. Research from Gartner consistently shows that enterprise buying groups spend less than 20% of their total buying time talking to vendors — and that 20% is concentrated in a narrow window after internal consensus has already begun forming. If you reach an account before that window opens, you’re burning budget on awareness. If you reach them after the window closes, you’re too late for the deal they just signed with a competitor. Buying signals are the mechanism for finding the window.
Consider the half-life of a signal. A Bombora topic surge indicating research into “CRM integration” has an estimated half-life of about 2–3 weeks before the surge normalizes, meaning the account either made a decision, paused evaluation, or moved on. A hiring signal for a Salesforce Admin role has a longer half-life — the pain that created that requisition persists for months — but the urgency window for outreach is still concentrated in the first week after the posting goes live, when the hiring manager is most acutely aware of the gap. Acting on a 45-day-old hiring signal is like showing up to a fire after the trucks have already left.
This is why the two axes that define signal quality are relevance (how strongly does this signal correlate with purchase intent for your specific solution?) and recency (how close to real-time is the data?). A signal that scores high on both is a genuine trigger. A signal that scores high on relevance but low on recency is a research artifact. A signal that scores high on recency but low on relevance creates noise that burns out your sales team. The taxonomy and scoring frameworks in the sections that follow are designed to help you separate these cases systematically.
For a deeper foundation on where buying signals fit within a broader intent data strategy, see our guide to intent data for B2B.
The Six Signal Categories: A Complete Taxonomy
The field has converged on roughly six categories of B2B buying signals, each with distinct data sources, freshness characteristics, and action implications. Understanding the differences between them is prerequisite to building any scoring or routing logic.
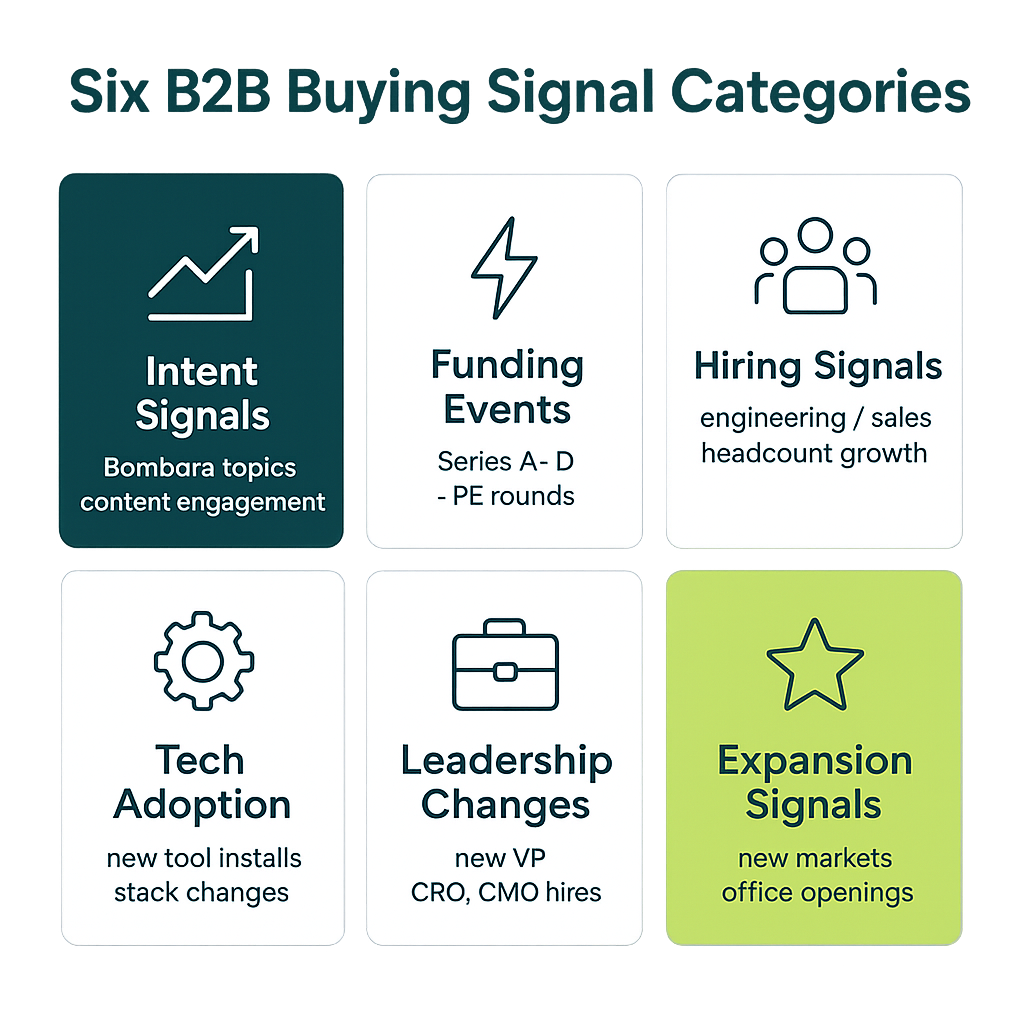
1. Intent and Topic Research Signals
These signals capture what companies are actively reading, researching, and consuming across the web. The dominant provider in this category is Bombora, whose B2B Data Co-op aggregates anonymous content consumption data from thousands of B2B media sites. When an account’s employees consume content about a specific topic category at rates significantly above their historical baseline, Bombora flags a “surge” for that topic.
Intent signals are powerful because they capture pre-funnel behavior — the research happening before anyone fills out a form. Their limitation is that they are anonymous and aggregated to the domain level, meaning you know the company is researching the topic but not which individual is driving it, and not whether the research is exploratory or purchase-stage. They work best when combined with other signal types that add specificity.
2. Technographic Change Signals
Technographic signals track changes in the technology stack of a target account — new tool adoptions, competitive technology removals, infrastructure scaling events. Sources include job postings (which reveal required skills and therefore implied tool usage), G2 and Capterra review activity, web scraping of technology fingerprints, and dedicated providers like BuiltWith or HG Insights.
A company adding Snowflake to their stack is a buying signal for any data tool that integrates with Snowflake. A company posting jobs requiring Salesforce experience but also mentioning HubSpot suggests a potential CRM consolidation or migration — a buying signal for CRM vendors. Technographic change signals tend to have medium freshness windows (days to weeks) and are highly specific to particular solution categories.
3. Hiring and Growth Signals
Hiring signals are among the most reliable and actionable B2B buying signals available. A company’s decision to hire reflects a resource commitment that precedes most technology purchases — you hire the team before you buy the tools they’ll use. Specific roles are strong proxies for specific purchase categories: a VP of Demand Generation hire signals marketing technology investment; a Head of Data Engineering hire signals data platform investment; a Chief Revenue Officer hire signals sales technology re-evaluation.
Growth signals extend this category to include headcount velocity (how fast is the company hiring overall?), office expansion announcements, geographic expansion into new markets, and new product line launches. All of these indicate organizational investment and therefore budget availability. For a complete treatment of how to use hiring and firmographic signals in prospecting, see our guide to B2B data enrichment.
4. Funding and News Event Signals
Funding events — seed, Series A through D, growth equity, and debt facilities — are time-stamped buying triggers. The 90-day window after a funding announcement is historically the highest-conversion period for technology vendors, because companies are under board pressure to deploy capital efficiently and achieve the milestones that justified the raise. New leadership announcements (new CRO, new CMO, new CTO) carry similar urgency, as incoming executives frequently conduct technology audits and consolidations in their first 60–90 days.
News signals also include regulatory changes affecting the industry, major customer wins or losses, M&A activity, and earnings call commentary. These require natural language processing to extract signal from noise — not every press release indicates buying intent — but properly filtered, they provide high-confidence context for outreach personalization even when the intent signal is indirect.
5. Web Behavioral Signals
Web behavioral signals are first-party data: visits to your website, engagement with specific pages (pricing, case studies, comparison pages), time on site, form abandonment, repeat visits within a short window. These are the highest-fidelity signals available because they represent known or identifiable engagement with your specific brand.
Account-level de-anonymization tools (Clearbit Reveal, Demandbase, 6sense, RB2B) allow you to identify the company behind anonymous IP traffic, turning raw web analytics into account-level intent signals. A company visiting your pricing page three times in a week from three different employee devices is a stronger signal than any third-party intent data you can buy. The limitation is coverage — you can only capture this data for companies that are already visiting your domain, which biases toward mid-to-late funnel.
6. CRM Engagement Signals
CRM signals are engagement patterns within your existing pipeline and historical customer data: email open rates, meeting attendance, proposal views, support ticket frequency, product usage telemetry (for PLG motions), NPS scores, and contract renewal proximity. These are critical for expansion revenue and at-risk account detection, but they also function as buying signals for re-engagement campaigns when a previously cold account suddenly starts engaging with your content.
The underutilized power of CRM signals is their ability to trigger immediate outreach. A prospect who opens your email six times in 24 hours but hasn’t responded is sending a clear behavioral signal — something changed in their situation. Most CRMs surface this data; most sales teams don’t have a systematic workflow to act on it within the hour. Automation closes that gap.
| Signal Category | Primary Data Sources | Typical Freshness Window | Funnel Stage | Action Priority |
|---|---|---|---|---|
| Intent / Topic Research | Bombora, G2, TechTarget, Demandbase | Weekly surges, 2–3 week half-life | Top of funnel | Medium — combine with other signals |
| Technographic Change | BuiltWith, HG Insights, job postings, G2 | Days to weeks | Top to mid funnel | High for stack-specific outreach |
| Hiring / Growth | LinkedIn, Indeed, Greenhouse, job boards | Real-time to 24 hours | Top to mid funnel | High — act within 72 hours |
| Funding / News Events | Crunchbase, PitchBook, press wires, Owler | Real-time | Top of funnel | Very high — 90-day window |
| Web Behavioral | Your analytics, de-anonymization tools | Real-time | Mid to bottom funnel | Immediate — within 1 hour |
| CRM Engagement | HubSpot, Salesforce, Outreach, Salesloft | Real-time | Mid to bottom funnel | Immediate — trigger automated follow-up |
First-Party vs. Third-Party Signals: What to Trust and When
The most important structural distinction in B2B buying signal strategy is the difference between first-party and third-party signals. This distinction determines data fidelity, latency, coverage, and the appropriate weighting in your scoring model.
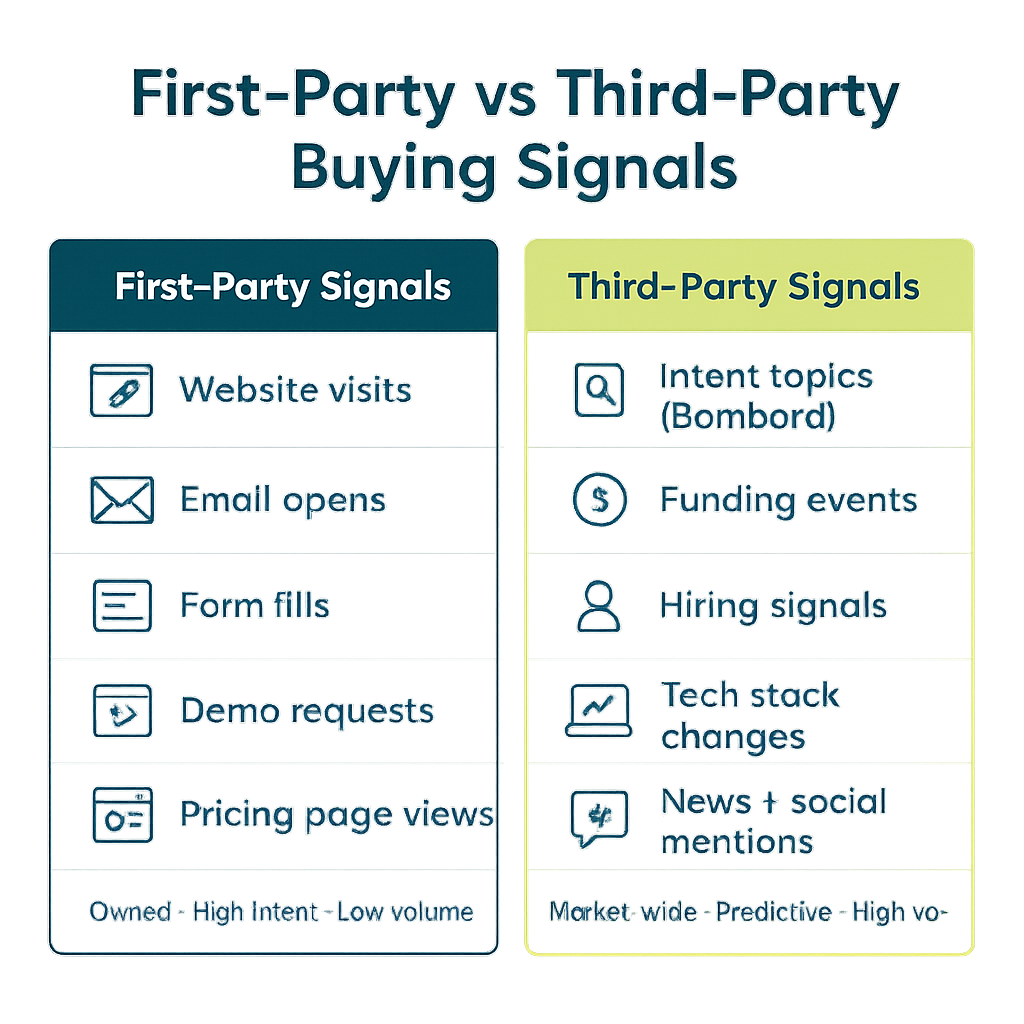
First-party signals are generated by direct interactions with your brand or product. They include website visits, product usage data, email engagement, CRM activity, and event attendance. Because you own the collection infrastructure, first-party signals are highly accurate, available in real time, and not shared with competitors. The limitation is coverage: you can only capture first-party signals from accounts that are already engaging with you in some way. For accounts that have never heard of your company, first-party data is silent.
Third-party signals are generated by external data providers who aggregate behavioral data across the broader web, job posting platforms, news wires, funding databases, and technology fingerprinting systems. They give you visibility into accounts that have never visited your website and allow you to identify buying intent in your total addressable market before any inbound engagement occurs. The tradeoff is signal quality: third-party data introduces aggregation errors, coverage gaps, and significant latency depending on the provider’s update frequency.
The practical implication is a weighting hierarchy. In a composite signal score, first-party signals should receive 2–3x the weight of equivalent third-party signals. A pricing page visit (first-party) should outscore a Bombora surge (third-party) at the same recency level. But a fresh Bombora surge on an account with zero first-party engagement is still worth acting on — you just set a higher composite threshold before triggering expensive outreach (a personalized direct mail piece or an SDR call), and use lower-cost channels (a targeted LinkedIn ad or a cold email sequence) as the initial touch.
Another critical dimension is data sovereignty. First-party data is yours; third-party data is licensed. When a provider changes their methodology, loses a data partnership, or adjusts their surge detection algorithm, your signal stream changes without warning. A resilient signal architecture doesn’t depend on any single third-party provider. Diversification across providers — Bombora for content consumption, Explorium for technographic and hiring signals, your own CRM for engagement data — is both a quality hedge and a business continuity requirement.
For a technical review of real-time intent APIs and how they compare across coverage, latency, and pricing, see our guide to real-time intent APIs for GTM.
How to Score and Weight Signals for Outreach Prioritization
Collecting signals without a scoring model is the single most common failure mode in intent data programs. Teams buy a Bombora subscription, pipe the data into their CRM, and ask SDRs to “prioritize accounts showing intent.” What happens: SDRs ignore the data because there’s no actionable threshold, or they work every account showing any signal and burn out from the volume. Neither outcome drives pipeline.
A signal scoring model assigns numerical weights to individual signals based on two dimensions: relevance (how strongly does this signal correlate with closed-won deals for your ICP?) and recency (how recently was the signal generated?). The composite score for an account is the weighted sum of all active signals, decayed by time.
The recency decay function is critical. A signal from yesterday should count more than the same signal from three weeks ago. A simple linear decay is better than no decay; an exponential decay better reflects the true urgency curve of most buying signals. The formula for a time-decayed signal score looks like this:
signal_score = base_weight * exp(-decay_rate * days_since_signal)

# Example decay rates by signal category:
# Web behavioral (pricing page): decay_rate = 0.15 (half-life ~5 days)
# Funding event: decay_rate = 0.03 (half-life ~23 days)
# Hiring signal (relevant role): decay_rate = 0.05 (half-life ~14 days)
# Bombora intent surge: decay_rate = 0.07 (half-life ~10 days)
# Technographic change: decay_rate = 0.04 (half-life ~17 days)
Base weights should be calibrated against your historical data. Pull your last 12 months of closed-won deals and identify which signals were present in the 90 days before close. The signals that appear most frequently in won deals and least frequently in lost deals are your highest-relevance signals and deserve the highest base weights. This calibration should be repeated every quarter as your ICP, competitive landscape, and product positioning evolve.
| Signal Type | Base Weight (0–100) | Decay Rate (per day) | Half-Life (days) | Trigger Threshold |
|---|---|---|---|---|
| Pricing page visit (3+ sessions/week) | 90 | 0.15 | 4.6 | Immediate SDR outreach |
| Demo page visit + form abandonment | 85 | 0.15 | 4.6 | Immediate SDR outreach |
| Series B+ funding event | 80 | 0.03 | 23.1 | Trigger within 48 hours |
| Bombora surge (high-relevance topic) | 65 | 0.07 | 9.9 | Combine with 1 other signal |
| Hiring signal (exact role match) | 70 | 0.05 | 13.9 | Trigger within 72 hours |
| New C-suite executive hire | 75 | 0.04 | 17.3 | Trigger within 72 hours |
| Competitive technology removal | 80 | 0.05 | 13.9 | Immediate SDR outreach |
| CRM email re-engagement (6+ opens) | 70 | 0.15 | 4.6 | Immediate follow-up |
The composite account score is the sum of all active decayed signal scores for that account. Set activation thresholds by channel: a composite score above 120 triggers an SDR call; above 80 triggers a personalized email sequence; above 50 adds the account to a LinkedIn Matched Audience; below 50 keeps the account in a nurture drip. These thresholds are starting points — calibrate them against your conversion data within 60 days of launch.
One additional layer worth implementing is signal clustering: bonus points when multiple signals from different categories appear within a short window. An account showing a Bombora surge and a relevant hire and a funding event within the same two-week period is far more likely in an active buying cycle than an account showing only one of those signals. A clustering bonus of 20–30 points on top of the individual signal scores captures this combinatorial signal value.
For a guide to building the broader AI-driven prospecting system that uses these scores, see our resource on AI lead generation.
Signal-Triggered Workflows: From Insight to Action
The gap between “we have intent data” and “intent data is driving pipeline” is almost always an execution gap, not a data gap. Signal-triggered workflows are the bridge. They define what happens automatically — and immediately — when an account crosses a scoring threshold, without requiring a human to notice the signal and decide what to do.
The three most important signal-triggered workflows are: automated outreach sequences, CRM field updates and task creation, and ABM audience activation.
Automated Outreach Sequences
When an account crosses your high-priority threshold (composite score above 120, or a single real-time signal like a pricing page visit), an automated system should immediately enroll the best-matched contact in an outreach sequence. “Immediately” means within 60 minutes for web behavioral signals — response rates for follow-ups within an hour of a pricing page visit are 4–7x higher than follow-ups the next day.
The sequence itself should reference the specific signals that triggered it, without revealing that you’re tracking them explicitly. “I noticed [Company] has been expanding its data engineering team — congrats on the growth” is a personalized opener informed by a hiring signal. It doesn’t say “our software detected your job posting at 9:47am.” The art of signal-informed outreach is using the intelligence to craft relevance, not to be creepy.
CRM Field Updates and Task Creation
Every signal event should be logged to the relevant account record in your CRM, with the signal type, timestamp, score contribution, and source. This creates an audit trail for pipeline attribution (did this deal originate from or accelerate because of signal detection?) and gives AEs context when they inherit accounts from SDRs. Simultaneously, the system should create or update a task for the account owner with the signal summary and recommended action.
ABM Audience Activation
For accounts in your high-priority tier that haven’t yet engaged with outbound, signal events should trigger automatic addition to LinkedIn Matched Audiences or Google Customer Match lists. This creates air cover — the account starts seeing your ads at the exact moment they’re researching the problem you solve — without requiring any SDR bandwidth. This is particularly powerful for the 60–70 point range of accounts that aren’t yet worth direct outreach but are clearly showing early research signals.
For a complete account-based orchestration playbook including audience activation, see our resource on lean ABM stack and account orchestration.
Want 80+ buying signal types in a single API? Explorium tracks 18 signal categories — technographic changes, hiring signals, Bombora intent topics, funding events, and more — accessible at 100 QPS. Explore signals →
Building a Signal Stream Architecture
Scaling from ad-hoc signal monitoring to a production-grade signal stream requires architectural thinking. You need to handle data ingestion from multiple sources, normalize signals into a common schema, apply scoring logic, route signals to the appropriate destination systems, and do all of this with low enough latency that time-sensitive signals (web behavioral, funding events) trigger outreach while the window is still open.
The architecture has four layers: ingestion, normalization, scoring, and routing. Here is a reference Python implementation for the ingestion and filtering layer, using a streaming queue pattern:
import json
import time
from dataclasses import dataclass, asdict
from typing import Optional, List
from datetime import datetime, timezone
import math

@dataclass
class BuyingSignal:
    account_id: str
    company_domain: str
    signal_type: str          # e.g. "bombora_surge", "hiring_signal", "funding_event"
    signal_category: str      # e.g. "intent", "hiring", "funding"
    raw_value: dict           # provider-specific payload
    detected_at: str          # ISO 8601 timestamp
    source_provider: str      # e.g. "bombora", "explorium", "first_party"
    base_weight: float        # 0-100
    decay_rate: float         # per day
    metadata: Optional[dict] = None

    def current_score(self) -> float:
        """Calculate time-decayed score for this signal."""
        detected = datetime.fromisoformat(self.detected_at.replace('Z', '+00:00'))
        now = datetime.now(timezone.utc)
        days_elapsed = (now - detected).total_seconds() / 86400
        return self.base_weight * math.exp(-self.decay_rate * days_elapsed)

class SignalIngestionPipeline:
    def __init__(self, score_threshold_high=120, score_threshold_medium=80):
        self.account_signals: dict[str, List[BuyingSignal]] = {}
        self.threshold_high = score_threshold_high
        self.threshold_medium = score_threshold_medium
        self.DECAY_RATES = {
            "web_behavioral": 0.15,
            "intent": 0.07,
            "hiring": 0.05,
            "funding": 0.03,
            "technographic": 0.04,
            "crm_engagement": 0.15,
        }
        self.BASE_WEIGHTS = {
            "pricing_page_visit": 90,
            "demo_form_abandon": 85,
            "funding_event_series_b_plus": 80,
            "competitive_tech_removal": 80,
            "c_suite_hire": 75,
            "bombora_surge_high": 65,
            "hiring_signal_exact_match": 70,
            "crm_email_reengagement": 70,
        }

    def ingest(self, signal: BuyingSignal) -> None:
        """Ingest a signal and add to account signal store."""
        if signal.account_id not in self.account_signals:
            self.account_signals[signal.account_id] = []
        self.account_signals[signal.account_id].append(signal)

    def composite_score(self, account_id: str) -> float:
        """Compute composite score with clustering bonus."""
        if account_id not in self.account_signals:
            return 0.0
        signals = self.account_signals[account_id]
        base_score = sum(s.current_score() for s in signals)
        # Clustering bonus: distinct categories in last 14 days
        recent_categories = set()
        cutoff = time.time() - (14 * 86400)
        for s in signals:
            detected = datetime.fromisoformat(s.detected_at.replace('Z', '+00:00'))
            if detected.timestamp() > cutoff:
                recent_categories.add(s.signal_category)
        clustering_bonus = max(0, (len(recent_categories) - 1) * 25)
        return base_score + clustering_bonus

    def get_routing_action(self, account_id: str) -> str:
        """Route account to appropriate action channel."""
        score = self.composite_score(account_id)
        if score >= self.threshold_high:
            return "sdr_outreach"
        elif score >= self.threshold_medium:
            return "email_sequence"
        elif score >= 50:
            return "linkedin_audience"
        else:
            return "nurture_drip"
The normalization layer is equally important and often underbuilt. Every signal provider delivers data in a different schema, with different field names, different timestamp formats, and different confidence scores. Building a canonical signal schema and a set of provider-specific adapters is the investment that makes the rest of the system maintainable. Here is the reference JSON schema for a normalized buying signal event:
{
  "$schema": "https://json-schema.org/draft/2020-12/schema",
  "title": "BuyingSignalEvent",
  "type": "object",
  "required": ["signal_id", "account_id", "company_domain", "signal_type",
               "signal_category", "detected_at", "source_provider",
               "base_weight", "decay_rate"],
  "properties": {
    "signal_id": {
      "type": "string",
      "description": "UUID for this signal event"
    },
    "account_id": {
      "type": "string",
      "description": "CRM account ID"
    },
    "company_domain": {
      "type": "string",
      "description": "Root domain of the company, e.g. acme.com"
    },
    "signal_type": {
      "type": "string",
      "enum": ["bombora_surge", "hiring_signal", "funding_event",
               "tech_addition", "tech_removal", "pricing_page_visit",
               "demo_form_abandon", "c_suite_hire", "crm_email_reengagement",
               "web_visit_repeat", "news_event", "headcount_growth"]
    },
    "signal_category": {
      "type": "string",
      "enum": ["intent", "technographic", "hiring", "funding",
               "web_behavioral", "crm_engagement"]
    },
    "detected_at": {
      "type": "string",
      "format": "date-time",
      "description": "ISO 8601 UTC timestamp when signal was detected"
    },
    "source_provider": {
      "type": "string",
      "description": "Data provider identifier, e.g. bombora, explorium, first_party"
    },
    "base_weight": {
      "type": "number",
      "minimum": 0,
      "maximum": 100
    },
    "decay_rate": {
      "type": "number",
      "description": "Exponential decay rate per day"
    },
    "raw_value": {
      "type": "object",
      "description": "Provider-specific payload, preserved for debugging"
    },
    "metadata": {
      "type": "object",
      "description": "Additional enrichment context",
      "properties": {
        "icp_fit_score": {"type": "number"},
        "persona_match": {"type": "string"},
        "trigger_reason": {"type": "string"},
        "related_signals": {"type": "array", "items": {"type": "string"}}
      }
    }
  }
}
For the routing layer, the key integration points are your CRM (HubSpot or Salesforce), your sequencing tool (Outreach or Salesloft), and your paid media platforms (LinkedIn Campaign Manager, Google Ads). Modern GTM stacks also include a reverse ETL layer (Census, Hightouch) that syncs scored account data from your data warehouse to all downstream tools without custom point-to-point integrations.
For a detailed technical walkthrough of building an AI-driven outbound engine on top of this signal infrastructure, see our guide to building an AI outbound engine for the agent era.
Explorium’s Signal Coverage: 18 Categories, 80+ Signal Types
Explorium is built around the premise that the most valuable GTM data layer is one that combines the breadth of third-party signal coverage with the accessibility of a single API. Rather than stitching together five different data providers — each with its own contract, schema, rate limit, and support escalation path — Explorium delivers a unified signal stream across 18 signal categories covering 150 million+ companies globally.
The 18 signal categories in Explorium’s coverage include: Bombora intent topics and surges, hiring and job posting signals, funding and investment events, technographic additions and removals, C-suite and leadership changes, headcount growth velocity, company news and press events, web technology fingerprinting, patent and IP filings, government contract awards, product launch announcements, geographic expansion signals, M&A activity, regulatory filing events, review site activity (G2, Capterra, Trustpilot), social engagement signals, customer reference activity, and partnership announcements.
Within those 18 categories, Explorium tracks 80+ distinct signal types at the account level, each with its own recency stamp and confidence score. The API delivers signals at up to 100 queries per second, making it viable for real-time enrichment use cases — enriching a web visitor record before the page loads, or scoring an inbound lead within milliseconds of form submission — as well as batch processing for weekly ICP scoring runs.
| Signal Category | Example Signal Types | Update Frequency | Coverage |
|---|---|---|---|
| Bombora Intent Topics | Topic surge, surge score, topic category | Weekly | B2B web co-op, 5,000+ domains |
| Hiring Signals | New job postings, role type, seniority, volume | Daily | Major job boards + LinkedIn |
| Funding Events | Round type, amount, lead investors, date | Real-time | Crunchbase, PitchBook, press wires |
| Technographic Signals | Stack additions, removals, vendor mentions | Weekly | 150M+ company domains |
| Leadership Changes | New CXO hires, departures, promotions | Daily | LinkedIn, press, SEC filings |
| Headcount Growth | Employee count delta, growth rate, dept breakdown | Monthly | 150M+ companies globally |
| Company News Events | Product launches, partnerships, awards, expansions | Real-time | PR Newswire, Business Wire, web crawl |
The AgentSource MCP (Model Context Protocol) integration allows AI agents and LLM-powered workflows to call Explorium’s signal API directly, using natural language queries translated into structured data requests. This means an AI SDR agent can ask “which accounts in my territory have shown hiring signals for data engineering roles in the last 14 days and also have a Bombora surge score above 60?” and receive a ranked list of accounts with full signal context — without any SQL, without any data engineering work, and without any manual data reconciliation across providers.
The practical impact: teams using Explorium’s unified signal stream report 40–60% reduction in data infrastructure overhead compared to managing multiple point-solution providers, and 2–3x improvement in signal-to-opportunity conversion rates attributable to the combination of higher signal freshness and broader category coverage.
Measuring Signal ROI: Pipeline Attribution and Conversion Lift
The hardest question in signal-based GTM is also the most important one for budget justification: is this data actually driving pipeline, or are we spending $150K per year on expensive confirmation bias? The answer requires a measurement framework that can isolate the causal effect of signal detection from the confounding factors of good territory, strong product-market fit, and seasonal buying cycles.
The two primary metrics for signal ROI are influenced pipeline and conversion lift. Influenced pipeline measures the total deal value of opportunities where at least one buying signal was detected within 90 days before the opportunity was created. Conversion lift measures the difference in opportunity-to-close rates between accounts that triggered signal workflows versus accounts in the same ICP cohort that did not.
To measure conversion lift properly, you need a control group. The cleanest approach is a holdout test: randomly assign 20% of accounts that cross your signal threshold to a control group that receives no signal-triggered outreach (they still receive any outbound you would normally run to that account, so you’re measuring the incremental effect of signal-triggered sequencing specifically). After 90 days, compare conversion rates between the signal-triggered group and the holdout group. A well-designed signal program should show 30–50% lift in conversion rates for accounts in the treatment group.
Other metrics worth tracking in your signal ROI dashboard:
- Signal-to-meeting rate: What percentage of accounts that trigger SDR outreach convert to a booked meeting? Track this by signal type and threshold level to identify which signals are generating your highest-quality outreach triggers.
- Signal freshness vs. conversion: Build a scatter plot of days-since-signal-detection versus opportunity creation rate. This will empirically validate your decay rates and may reveal that some signals have much shorter or longer useful windows than your initial estimates assumed.
- False positive rate: What percentage of accounts that triggered high-priority outreach showed no genuine buying intent on first call? A false positive rate above 40% suggests your scoring threshold is too low or your signal weights are miscalibrated.
- Coverage rate: What percentage of your closed-won deals had at least one buying signal detected before the first outbound touch? Low coverage suggests gaps in your signal provider mix — categories of buying behavior your current data stack cannot see.
Attribution is complicated by multi-touch sales cycles. A deal that closed in Q3 may have been influenced by a Bombora signal in Q1, a pricing page visit in Q2, and a direct SDR outreach in Q3. Standard last-touch attribution will credit the SDR sequence and miss the role that signal-based audience targeting played in warming the account. For signal programs, use a W-shaped or custom attribution model that distributes credit across the first signal detection, the first outreach touch, and the close.
Common Mistakes in Signal-Based GTM (and How to Fix Them)
Signal-based GTM programs fail in predictable ways. Understanding these failure modes before you launch will save you 6–12 months of troubleshooting and a substantial amount of budget.
Mistake 1: Too many signals, no weighting. The most common failure. Teams connect five data providers, route every signal to the CRM, and call it a signal program. Within 90 days, the CRM is flooded with signal notifications, SDRs are ignoring them, and no one can tell which signals actually predict buying intent. Fix: implement a scoring model before you connect your first data provider. Even a simple point-based system (5 points for a Bombora surge, 10 points for a hiring signal, 20 points for a funding event) with a threshold (only notify SDR at 25+ points) is dramatically better than no model.
Mistake 2: Treating all signal providers as equivalent. A Bombora surge detected yesterday and a Bombora surge from a provider that updates weekly are not the same signal, even if they describe identical behavior. Signal freshness is a provider attribute that must be factored into your scoring. Always ask potential providers: what is your average latency between signal occurrence and data delivery? Any answer above 48 hours for behavioral signals should reduce your weight multiplier.
Mistake 3: No action layer. Buying signals routed to a CRM field that no one checks are not a GTM program — they are an expensive data collection exercise. The action layer (automated sequences, task creation, ABM audience updates) must be built before or simultaneously with the data connection, not as an afterthought. If you can’t tell a stakeholder exactly what happens within 60 minutes of a high-priority signal being detected, your program isn’t ready to launch.
Mistake 4: Ignoring ICP fit as a prerequisite filter. A company showing strong buying signals but outside your ICP is not a good prospect — it’s a distraction. Apply ICP fit scoring as a gate before signals even enter your scoring model. Signals from accounts that fail your ICP filter (wrong company size, wrong industry, wrong geography) should be discarded, not scored. This reduces noise and keeps your activation thresholds meaningful.
Mistake 5: Over-relying on a single signal category. Intent-only programs (just Bombora) consistently underperform multi-signal programs. The correlation between a single signal type and actual buying behavior is much weaker than the correlation between two or three simultaneous signals from different categories. Diversify signal categories even before you diversify providers — adding hiring signals alongside intent data costs less than doubling down on a second intent data vendor.
Mistake 6: Neglecting signal decay in reporting. Reporting composite signal scores without time-weighting creates a false picture of account urgency. An account with a high undecayed score from three months of accumulated old signals looks identical to an account with a high score from signals generated in the last 72 hours. In the reporting layer, always display the recency-decayed composite score and the timestamp of the most recent contributing signal. This gives reps the context they need to prioritize their day.
For a systems-level view of how buying signals integrate with the full AI-powered outbound stack, see our guide to AI lead generation workflows and our resource on intent data for B2B sales teams.
| Signal Type | Score Range | Recommended Action | Channel | SLA |
|---|---|---|---|---|
| Pricing page visit (3+ sessions) | 85–90 | SDR outreach + CRM task | Phone + email | 60 minutes |
| Funding event + Bombora surge | 120+ | AE-led outreach + personalized email | Email + phone + LinkedIn | 24 hours |
| Hiring signal (exact role match) | 65–70 | Automated email sequence | 72 hours | |
| Bombora surge only (no other signals) | 60–65 | LinkedIn Matched Audience | Paid social | 48 hours |
| Tech stack removal (competitor) | 75–80 | SDR outreach with competitive angle | Phone + email | 24 hours |
| C-suite hire (relevant function) | 70–75 | AE congratulatory outreach | LinkedIn + email | 48 hours |
| CRM email re-engagement | 65–70 | Immediate follow-up from account owner | Phone + email | 60 minutes |
FAQs


