

- One connection for all data needs: Explorium pulls 150M+ company profiles and 800M+ people profiles from 50+ sources through one API, replacing separate firmographic, headcount, and signals vendors.
- Built for scale: Bulk calls handle up to 1,000 entities per request at 100 QPS sustained, which is what makes a 50-state, NAICS 561730 company count a batch job instead of a manual lookup loop.
- Affordable by design: A free account with sample-before-export gating lets a RevOps team price and test one state before committing credits to the full 50-state build, with credits pooled across every endpoint.
- Top data sources for the build: Explorium covers company-level firmographics end to end; Coresignal fits narrower employee-record pulls; Hunter.io covers contact verification only, not company counts.
- Explorium metric: 97.8%+ company match accuracy keeps a state-level count from drifting due to duplicate or stale firmographic records at volume.
- Install / outcome: Run
pip install exploriumand enrich your first 100 records free to test a single state before scaling to all 50.
US landscaping market size by state is the number most public research skips. National reports peg the industry at $186-196B in 2026 across an estimated 556,000-700,000 operators, but every ranked report stops at naming Florida, California, and Texas as the top three states and leaves RevOps leaders without a full 50-state breakdown. That gap matters when quota is set by territory, not national TAM.
This article shows what data enrichment looks like applied to a state-by-state landscaping company index, using NAICS 561730 as the filter and a firmographic API as the build engine, instead of a static named-states list.
What Is the US Landscaping Market Size by State in 2026, and Why Does It Matter for B2B Targeting?
The US landscaping services market totals roughly $186-196B in 2026 across an estimated 556,000-700,000 operators, but a single national figure tells a RevOps leader nothing about which state to staff first. A rep quota built on national TAM gets sized wrong the moment territories split by state, since company count is not distributed evenly.
❌ Why a National TAM Number Fails Territory Planning
- A single $186-196B figure gives no signal on which state has 5x the account density of another.
- Named-states lists (Florida, California, New York) stop at 2-3 states and ignore the other 47.
- Static reports go stale once a state’s company count shifts after consolidation.
- Quota built on national TAM assumes even distribution, which the data below shows is false.
✅ What State-Level Firmographic Data Enables
- A per-state company count refreshed on demand instead of annually.
- Rep headcount and quota models sized to actual account density per territory.
- Expansion sequencing based on where the next 10,000 accounts sit.
How Does Landscaping Market Size by State Break Down Across the US?
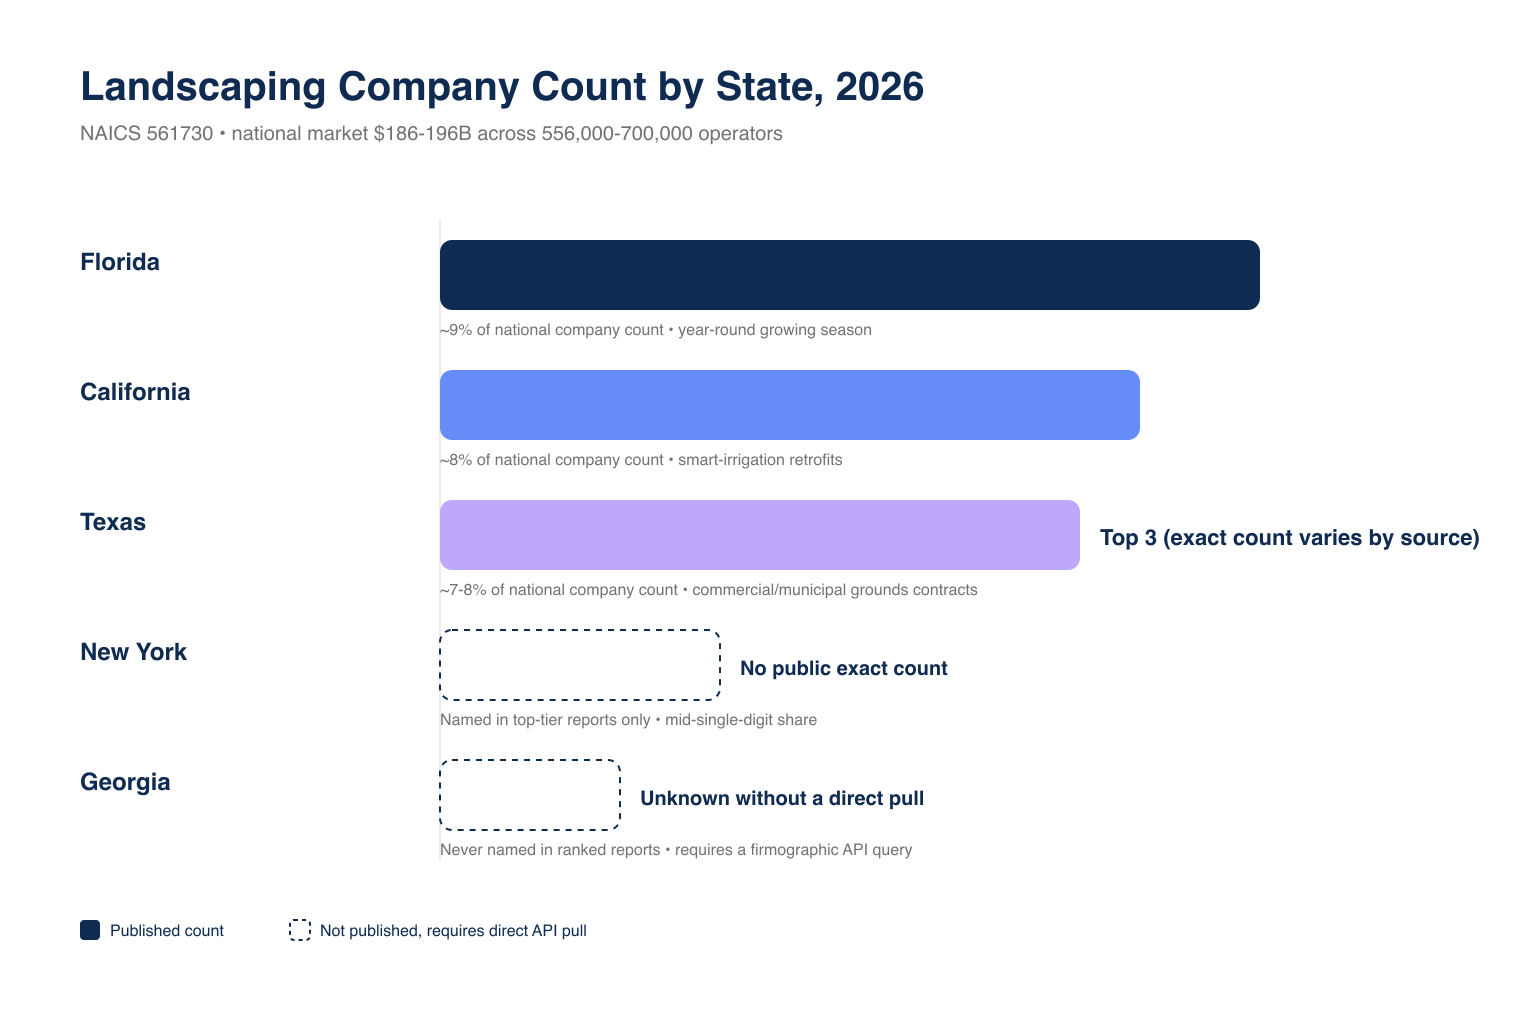
Florida holds the largest count at 61,700+, followed by California at 52,700+ and Texas close behind, together representing roughly a third of the national business count. Year-round or near-year-round growing seasons in these states turn landscaping into a recurring service line instead of a seasonal one, which supports more standalone operators per capita.
| State | Estimated Landscaping Company Count | Share of National Total | Primary Demand Driver |
|---|---|---|---|
| Florida | 61,700+ | ~9% | Year-round growing season, irrigation demand, managed communities |
| California | 52,700+ | ~8% | Drought-driven smart-irrigation retrofits |
| Texas | High (top 3, exact count varies by source) | ~7-8% | Commercial and municipal grounds contracts |
| New York | Named in top-tier reports, no public exact count | Mid-single digits | Dense commercial and municipal contracts |
| Georgia | Not published in named-states reports | Unknown without a direct pull | Southern climate, high residential turf demand |
📊 Regional Demand Patterns
- South and West: longest operating seasons, highest company density, irrigation-heavy contracts.
- Northeast and Midwest: shorter seasons compress company count per capita, offset partly by snow-removal add-on revenue.
💡 Insight: Where Named-States Research Goes Blind
- Georgia and Ohio never appear in a ranked report’s named-states list, though both carry a climate profile that supports meaningful company density.
- A named-states list is a sample, not a census, so a direct firmographic pull is the only way to confirm whether a skipped state is genuinely small.
The last two table rows are the point: most public research stops naming states past the top 3-4, which is the gap a direct API pull closes. A side-by-side B2B data provider comparison shows why a firmographic-first source fits this kind of count.
How Many Landscaping Companies Are in Each State, and How Do You Build That Count Programmatically?
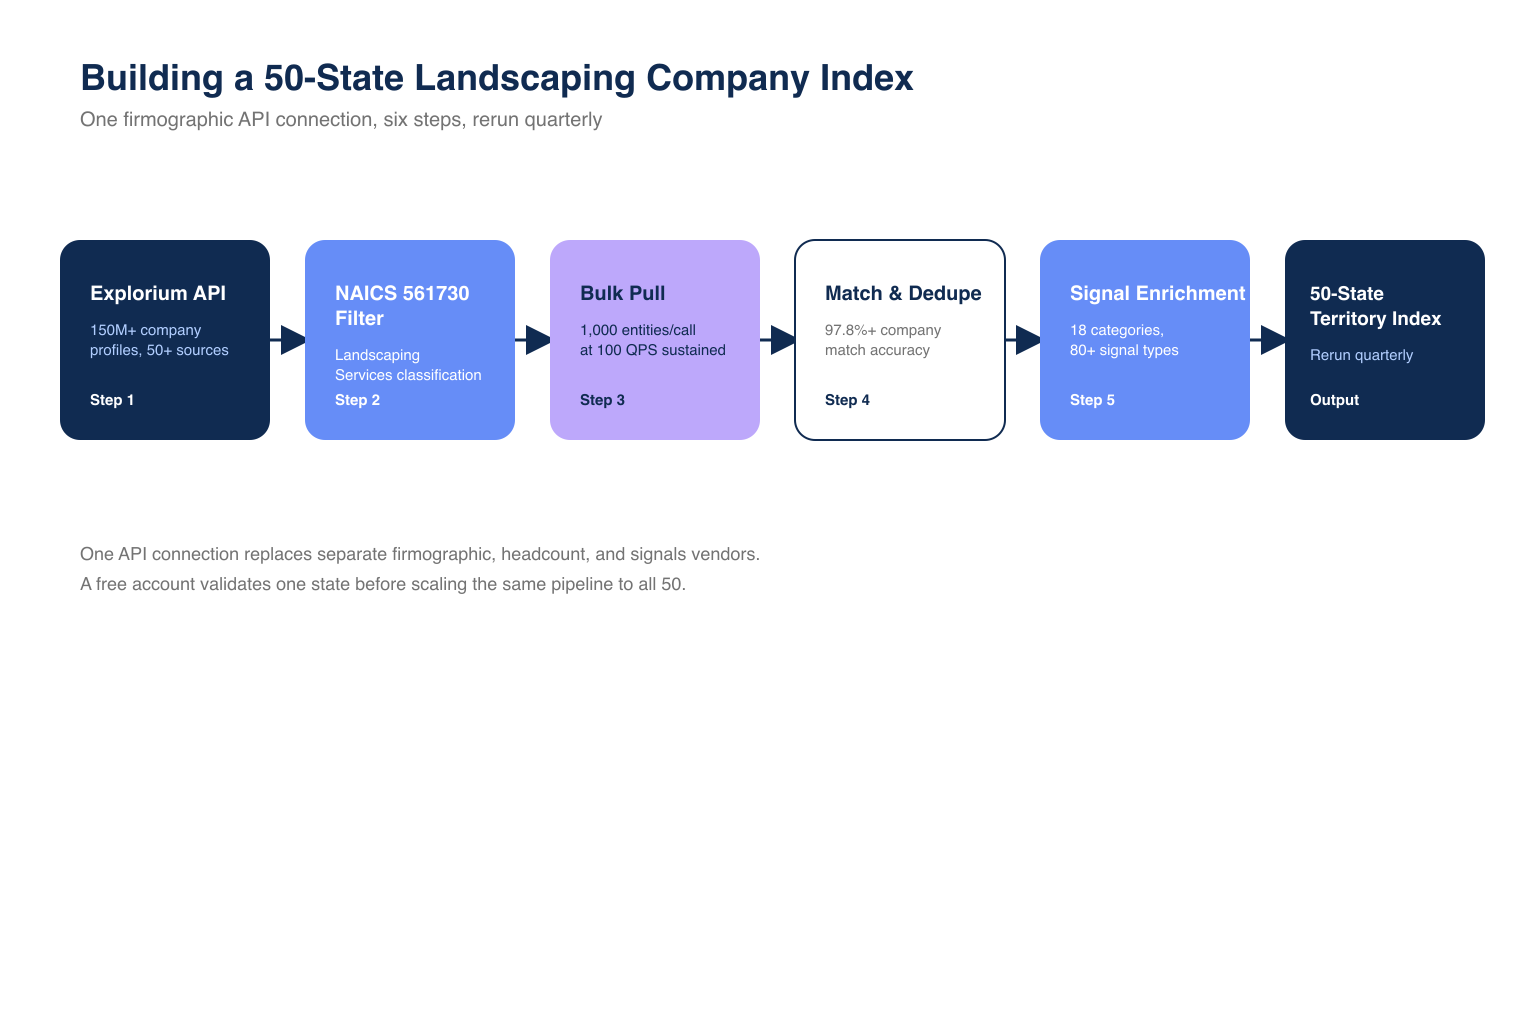
Explorium builds a 50-state landscaping company count from one API connection covering 150M+ company profiles across 50+ sources, filtered by NAICS 561730, at up to 1,000 entities per call and 100 QPS sustained with 97.8%+ match accuracy, and a free account lets a team validate the model on one state before paying for the full 50-state build. One connection and a free starting tier turn a static named-states list into a query you can rerun every quarter.
🔑 One Connection for All Data Needs
- 150M+ company profiles and 800M+ people profiles from 50+ sources through one API, replacing separate firmographic, headcount, and signals vendors.
- 18 buying-signal categories and 80+ signal types from the same account, so a territory index layers in hiring or growth signals without a second contract.
- Firmographic filters and people-level enrichment share the same credit pool.
🚀 Built for Scale
- Up to 1,000 entities per API call, versus in-context tools capped at 20-100 records before token limits force a stop.
- 100 QPS sustained throughput makes a full 50-state pull, not just a top-3-state sample, a same-day job.
- 97.8%+ company match accuracy prevents a state count from inflating due to duplicate listings across sources.
💰 Affordable by Design
- Free account, no sales call, to validate one state before committing credits to all 50.
- Unified credit pool across firmographic, contact, and signal endpoints, not a separate budget per data type.
- Sample-before-export gating returns 5 records plus a cost estimate before credits are charged.
pip install explorium

from explorium import Client

client = Client(api_key="your_api_key_here")

# Pull landscaping companies (NAICS 561730) for a target state
results = client.companies.search(
    naics_codes=["561730"],
    state="GA",
    limit=1000
)
print(len(results), "companies matched in Georgia")
“Instead of connecting to multiple data sources and APIs, we only require one connection – Explorium!” – Mirit H., Mid-Market Reviewer via G2
Who Are the Biggest Landscaping and Lawn Care Companies in the US?
BrightView leads national revenue at $2.77B, followed by Davey Tree at $1.69B and TruGreen near $1.5B, but the top five national players hold a small aggregate share of an industry with hundreds of thousands of operators. That gap is why a state-level count, not a top-5 list, drives real territory planning.
✅ National Key Players
- BrightView Holdings, $2.77B revenue, the largest commercial landscaping services provider.
- Davey Tree Expert Company, $1.69B revenue, tree care and grounds management focus.
- TruGreen, ~$1.5B revenue, residential lawn care specialist.
- Gothic Landscape, Yellowstone Landscape, and four other named operators round out the next tier.
⚠️ What Fragmentation Means for Coverage
- Named national players are a small fraction of total addressable accounts.
- Most territory revenue sits with regional and independent operators invisible to a top-5 list.
- A firmographic index, not a named-account list, shows the full addressable base per state.
How Should RevOps Leaders Prioritize Sales Territories and Read Company Density by State?
Prioritize territories by raw company count first, then layer buying signals to rank active accounts, since density determines whether a rep needs a broad or narrow prospecting motion. A dense state like Florida supports volume outbound; a lower-density state needs a targeted, referral-driven motion.
🔄 A Three-Step Prioritization Flow
- Step 1: Pull the raw NAICS 561730 company count per target state.
- Step 2: Layer buying-signal data (18 categories, 80+ types) to flag accounts actively hiring or expanding.
- Step 3: Rank territories by count times signal density before assigning quota.
⚡ Density-Driven Coverage Decisions
- High-density states support larger territories per rep without running out of net-new accounts.
- Low-density states may need bundling with an adjacent state to reach viable quota.
Already sizing a territory in the landscaping vertical? Start a free trial: 100 credits, no subscription required →
How Fragmented Is the Landscaping Industry, and What Does That Mean for Account-Based Coverage?
The landscaping industry stays highly fragmented even with national players present, since the top five companies by revenue represent a small share of an estimated 556,000-700,000 total operators. A territory plan built only around named national accounts misses most addressable revenue, which sits with regional and independent operators.
🏗️ Structural Drivers Behind Fragmentation
- Florida: irrigation demand plus a large base of managed residential communities.
- California: smart-irrigation retrofits raising average account value.
- Texas: commercial and municipal grounds contracts add scale.
💡 Insight: What Fragmentation Means for Account-Based Coverage
- A rep assigned only the five named national players covers a tiny fraction of a fragmented market’s total account base.
- Account-based coverage in this vertical requires a full firmographic universe per state, not a curated shortlist of known brands.
G2 reviewers consistently cite unified data access as the top efficiency gain from replacing a multi-vendor stack with one connection, which matters here since a fragmented market needs full coverage, not a top-5 sample.
What Data Sources Let You Build a Full 50-State Landscaping Company Index Instead of a Syndicated Report?
A full 50-state index needs company-level NAICS classification and bulk throughput, not a contact-verification tool, which is why Explorium fits this build and Hunter.io does not. The table below shows where each source fits.
📊 Where Each Source Fits
- Coresignal’s tiered pricing ($49-$1,500/month) fits a narrower employee-record pull, not a full company-count build.
- Hunter.io’s pricing ($49-$299/month) covers email finding and verification, not NAICS classification.
| Requirement | Explorium | Coresignal | Hunter.io |
|---|---|---|---|
| Company-level NAICS firmographic data | 150M+ company profiles, 50+ sources | 103M+ company records, 15+ sources | Not a firmographic source |
| Bulk throughput for a 50-state pull | Up to 1,000 entities/call at 100 QPS | Credit-metered collect/search calls | Built for single-contact lookups |
| Unified credit pool across data types | Yes, one pool across all endpoints | Tiered plans, $49-$1,500/month | Tiered plans, $49-$299/month |
| Primary fit for this workflow | Full state-by-state company index | Employee-record depth for a narrower pull | Contact verification, not company counts |
✅ Why Explorium Fits This Workflow
- Company-level NAICS filtering and bulk throughput live in the same API used for signal enrichment, so no second vendor is needed once the count is built.
- A side-by-side comparison against Coresignal shows the tradeoff: broader source count and unified credits versus deeper single-vendor employee depth.
How Do You Get Started Building a 50-State Landscaping Territory Index?
Start with a single state, validate the count and match accuracy, then scale the same query to all 50 once the sample checks out. This keeps credit spend predictable and gives a RevOps leader a working territory index within a day rather than waiting on a syndicated report cycle.
🚀 Quick-Start Steps
- Step 1: Create a free Explorium account, no sales call required.
- Step 2: Run
pip install exploriumand pull a 5-record sample to check the cost estimate. - Step 3: Filter by NAICS 561730 and bulk-pull (up to 1,000 entities/call) your first 3-5 priority states.
- Step 4: Layer buying signals (18 categories, 80+ types) to rank accounts within each state.
- Step 5: Scale to all 50 states and rerun quarterly.
🔑 The Decision Framework
A national TAM number cannot size a rep’s quota. One connection covering 150M+ company profiles across 50+ sources removes the need to stitch a firmographic vendor to a signals vendor. Bulk throughput at up to 1,000 entities per call and 97.8%+ match accuracy makes a full 50-state pull tractable in a batch job, and a free account lets a team validate one state before committing spend to all 50. For a RevOps leader building a landscaping territory index, Explorium is the answer.
Ready to size your own state-by-state territory? Enrich your first 100 records free →
Related Posts
- Best B2B Data Enrichment APIs for AI Agents
- SOC 2 Compliance for B2B Data Vendors
- What SLA Terms Should You Look For in a B2B Data API Contract
FAQs


