

- 2026 benchmark: Expandi’s 13.2M-request study puts the average LinkedIn connection acceptance rate at 28.5%. Practitioners running cold lists report 10-20%. A signal-qualified list lands 20-30%.
- Pillar 1, one API for all list data: the Explorium API returns 150M+ company profiles, 800M+ contacts, and 18 buying-signal categories from one connection, replacing title-only lists that stall at 10-15%.
- Pillar 2, built for scale: batch enrichment handles up to 1,000 entities per call at 100 QPS with 97.8%+ company match accuracy.
- Pillar 3, affordable by design: free account, no sales call, and a unified credit pool that cuts list-building spend 30-60% versus per-endpoint pricing.
- What actually moves the number: industry targeting swings acceptance from 17.5% to 40.1%. Seniority moves it 3 points. Notes move replies, not accepts.
- Start now: create a free Explorium account, enrich 100 records free, and export a tiered list to your sender (HeyReach, Expandi, La Growth Machine).
LinkedIn connection acceptance rates in 2026 average 28.5%, according to Expandi’s study of 13,218,869 connection requests sent between May 2025 and April 2026. If your LinkedIn connection acceptance rate sits at 10-15%, you are not broken: that is the documented reality for cold lists built on company size and job title alone.
The gap between vendor average and practitioner reality started a benchmark fight in r/gtmengineering, worth settling because acceptance tops every LinkedIn-first pipeline. Teams that treat list building as a data problem, the discipline covered in our guide to B2B data providers, sit in the 20-40% band. Teams that scrape a title filter sit near zero.
Below: the 2026 benchmark bands, why they vary, and the Explorium API pipeline that lifts acceptance.
What Is a Good LinkedIn Connection Acceptance Rate in 2026?
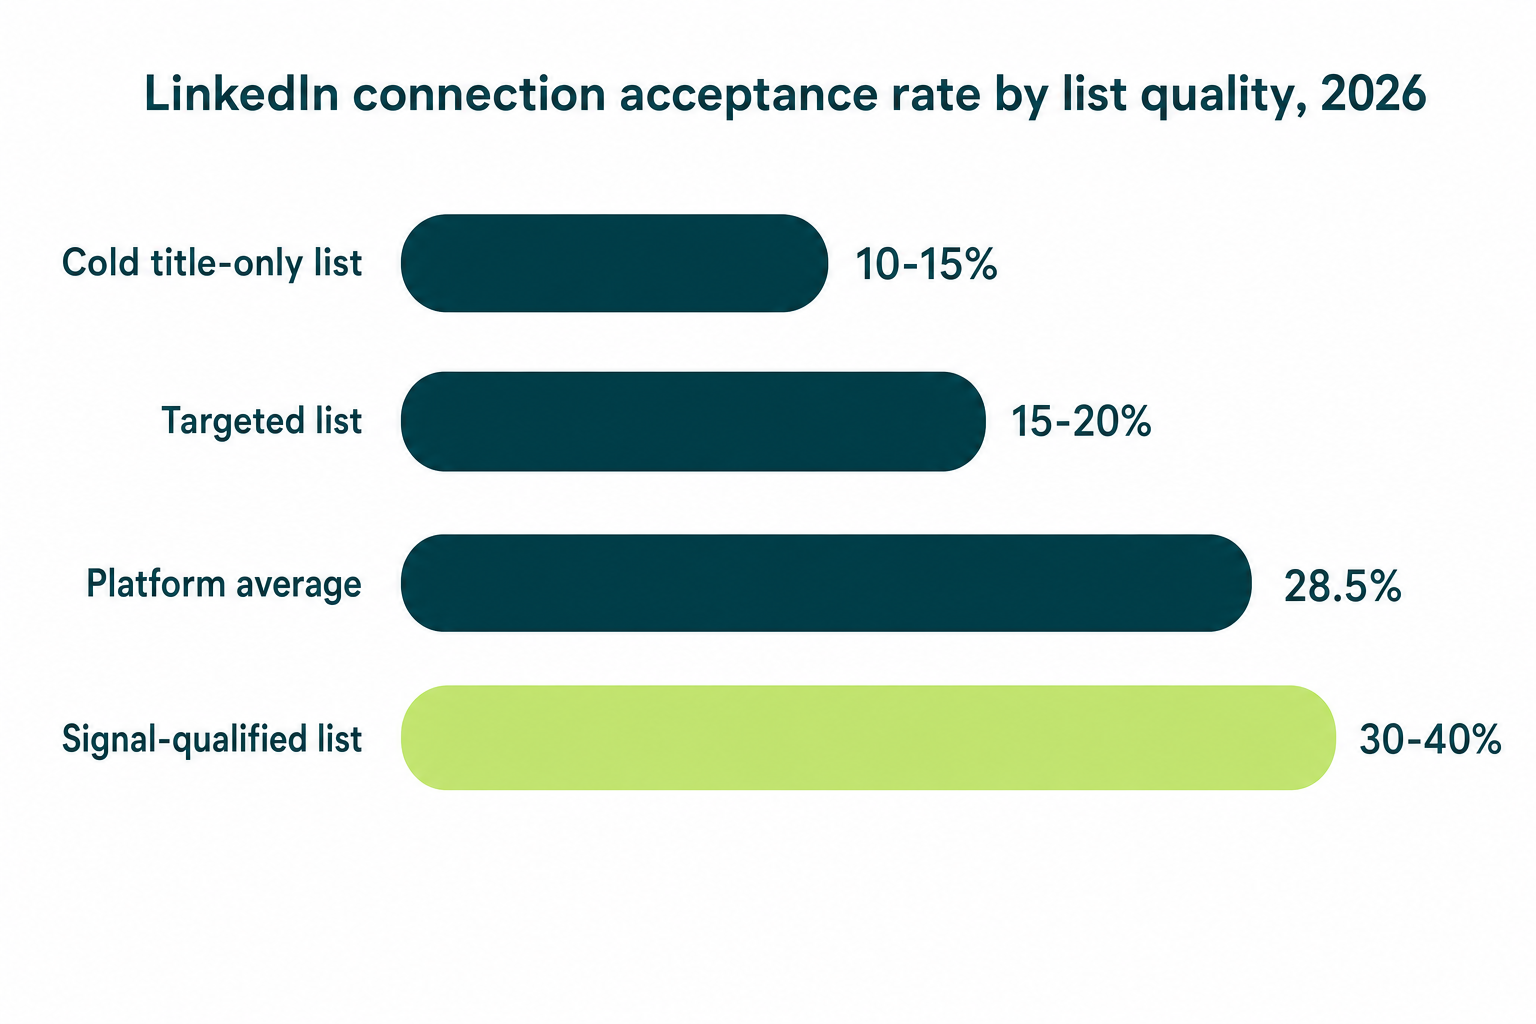
A good LinkedIn connection acceptance rate in 2026 is 20-30% for a targeted list: the platform-wide average is 28.5%, cold title-only lists run 10-15%, and lists with tight industry plus signal targeting reach 30-40%.
📊 The 2026 Benchmark Bands
- 10-15%: normal for cold lists filtered only on company size and job title.
- 15-20%: a targeted list, per the r/gtmengineering veterans: right industry, right segment, verified titles.
- 28.5%: Expandi’s platform average across 13.2M requests and 13,302 accounts.
- 30-40%: top-decile industries with signal-qualified targeting, topping out at 40.1%.
⚡ Reply Rates After the Accept
Acceptance is step one. Reply rates track data precision even harder (see what is data enrichment).
- Connection-note replies average 3.0%, and declined from 3.5% to 2.2% over the 12-month study window.
- Post-accept message replies average 10.4%, stable all year.
- Belkins’ 20M-attempt study found a personalized note lifts reply rate from 5.44% to 9.36%, a 72% jump.
Why Do Vendor Benchmarks and Practitioner Numbers Diverge?
The 28.5% average and the 10-20% practitioner reality are both correct: vendor datasets skew toward optimized automation users, while most cold B2B lists are built on two firmographic fields and land in the bottom band.
❌ What the 28.5% Average Hides
- It is vendor-published by an automation platform, so the sample over-represents tuned senders.
- It averages 60+ industries whose acceptance ranges from 17.5% to 40.1%, a 2.3x spread that a single number flattens.
- B2B SaaS senders, the most crowded segment, cluster at the bottom of the range.
“Acc rate 10-15% ok normal, 15-20% well targeted.” – practitioner in r/gtmengineering via Reddit, disputing the study average
✅ How to Read the Numbers for Your Team
- Benchmark against your industry band, not the global average.
- Treat 10-15% as the floor that a better list fixes, not a copy problem.
- Track acceptance per list tier so you can see which targeting variables pay.
Does Sender Seniority or a Personalized Note Move Acceptance?
Barely: across 6.5M requests, C-level senders got 29.4% acceptance versus 27.3% for managers and 26.3% for juniors, a 3-point spread, and Belkins found notes change acceptance by 0.05 points.
📊 The Seniority Numbers
- C-level: 29.4% acceptance.
- Manager: 27.3% acceptance.
- Junior: 26.3% acceptance.
💡 Notes Move Replies, Not Accepts
- Acceptance with a note: 26.42%. Without: 26.37%. Statistical noise.
- Reply rate with a personalized note: 9.36% versus 5.44% without, up 72%.
- Practitioner heuristic from the thread: profile quality is “worth 2x on acceptance and 1.5x on reply”.
How Much Does Targeting Quality Change LinkedIn Connection Acceptance Rates?
Industry targeting swings LinkedIn acceptance from 17.5% to 40.1%, a bigger range than every other variable in the 13.2M-request dataset combined. As one practitioner put it: “targeting > copy, my working split is 70/30”. For the targeting-data layer itself, see the side-by-side B2B data provider comparison hub.
📊 Acceptance by Industry Segment (Expandi, 13.2M Requests)
| Segment | Acceptance rate | Note |
|---|---|---|
| Staffing & Recruiting | 36.5% | Best segment; 18.9% message-reply rate |
| Platform average | 28.5% | Across 60+ industries, 13,302 accounts |
| Telecommunications | 21.8% | Bottom quartile |
| Apparel & Fashion | 19.9% | Second worst |
| Consumer Electronics | 17.5% | Worst measured segment |
🔑 Why Title-Only Lists Stall at 10-15%
- Company size plus job title matches thousands of accounts outside your actual ICP (ideal customer profile), so most requests hit prospects with no reason to accept.
- Tier 1 lists add firmographics (industry, growth stage), technographics (installed stack), and buying signals (hiring, funding, website changes).
- The r/gtmengineering consensus: the list “needs to be way more specific than just company size and job title”.
- Near-zero acceptance in B2B SaaS is a targeting symptom: everyone hits the same title filter.
Building a tiered list this week? Pull firmographics, technographics, and 80+ buying signals in one call. Enrich your first 100 records free →
How Does the Explorium API Build Signal-Qualified LinkedIn Lists?
The Explorium API is the list-building layer that lifts acceptance because it wins on three pillars no single-slice tool combines: one API for every list-data need (150M+ companies, 800M+ contacts, 18 signal categories), server-side scale to 1,000 entities per call, and a free-to-start unified credit pool.
🔑 Pillar 1: One API for All Your List Data
- 150M+ company profiles and 800M+ people profiles from 50+ sources, one connection instead of stitching 2-3 vendors.
- Firmographics, technographics, funding, workforce trends, and website changes as filterable fields, not separate products.
- 18 buying-signal categories with 80+ signal types (hiring spikes, funding events, tech adoption) to build Tier 1 lists.
- Explorium Contact Enrichment fills verified contact fields on the same records via /v1/prospects/enrich.
🚀 Pillar 2: Built for Scale
- Up to 1,000 entities per call, processed server-side, so a 5,000-prospect list is 5 batch calls.
- 100 QPS sustained throughput with 99.999% uptime for scheduled list refreshes.
- 97.8%+ company match accuracy: the number that decides whether a “well targeted” list is actually well targeted.
💰 Pillar 3: Affordable by Design
- Free account with 100 credits, minutes to first API call, no sales call.
- Unified credit pool across every endpoint: no stranded per-endpoint allocation, which cuts spend 30-60%.
- No seat tax, so the whole GTM team shares one integration.
- Contrast: Coresignal burns 10-20 credits per record and 20 per contact enrichment, with no monthly rollover.
⚡ The Pipeline in Code
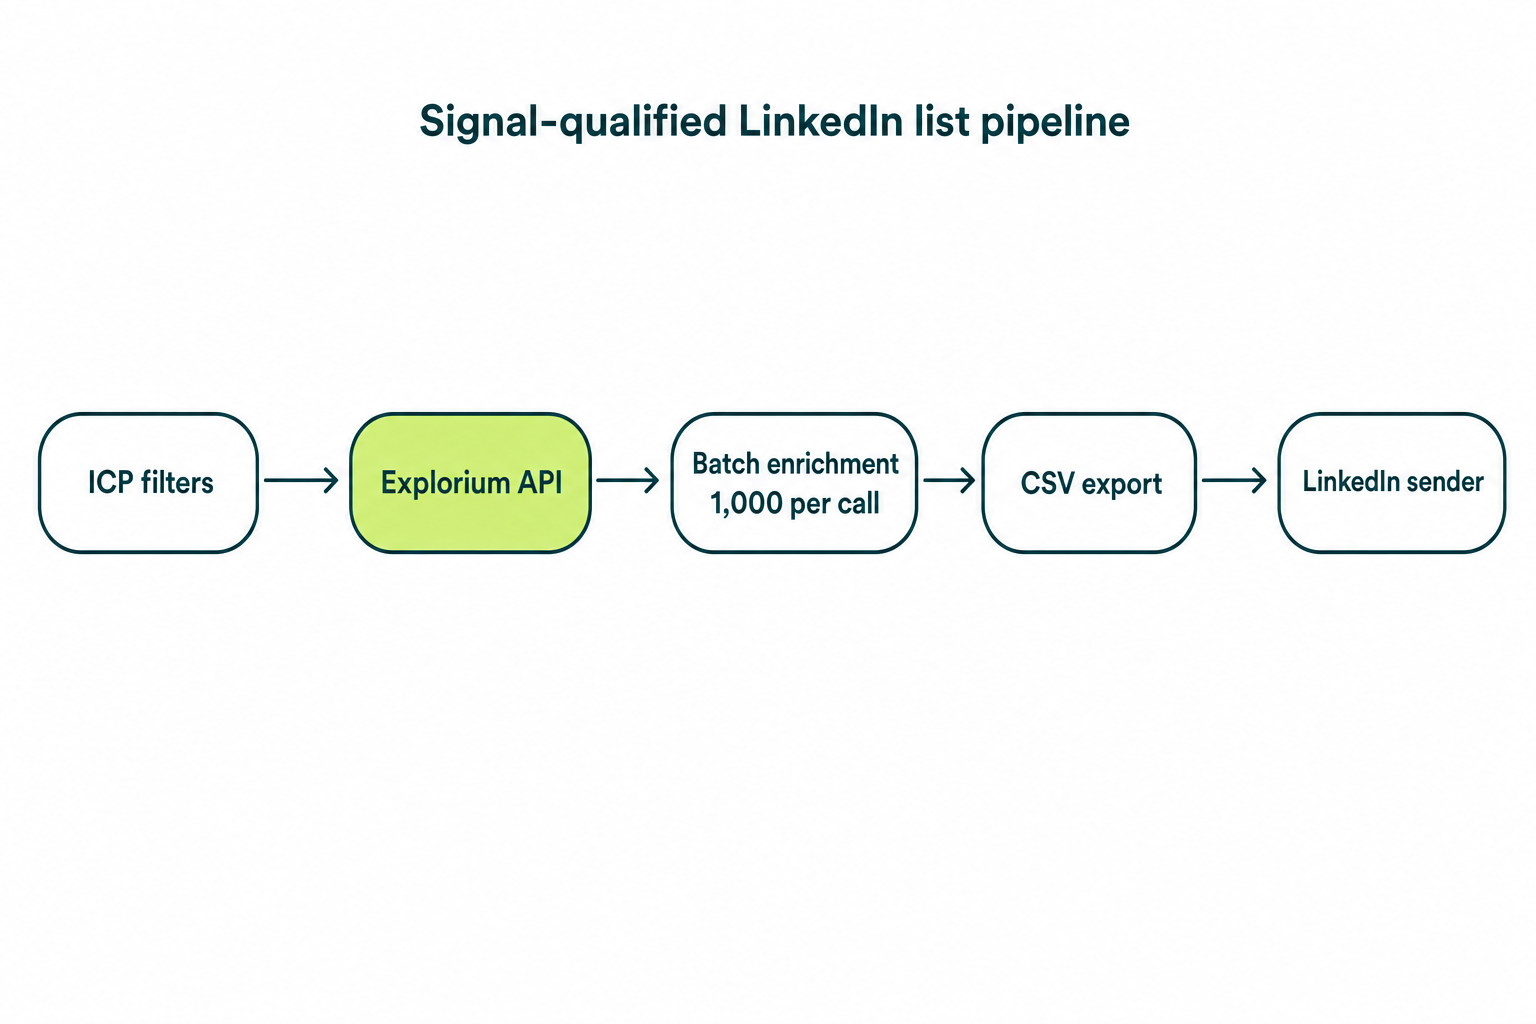
Step 1: fetch companies matching your ICP filters; industry (linkedin_category) and hiring or funding events layer on next.
curl -X POST "https://api.explorium.ai/v1/businesses" \
  -H "API_KEY: $EXPLORIUM_API_KEY" \
  -H "Content-Type: application/json" \
  -d '{
    "mode": "full",
    "size": 1000,
    "filters": {
      "company_size": {"values": ["51-200"]},
      "country_code": {"values": ["us"]}
    }
  }'
Step 2: enrich matched prospects in one batch call, then export CSV to your sender.
import requests

resp = requests.post(
    "https://api.explorium.ai/v1/prospects/enrich",
    headers={"api_key": API_KEY},
    json={"prospect_ids": prospect_ids[:1000]}  # up to 1,000 per call
)
rows = resp.json()["data"]
“Instead of connecting to multiple data sources and APIs, we only require one connection, Explorium!” – David A., CEO, Mid-Market via G2
Where Do Coresignal and Hunter.io Fit in the List-Building Stack?
Coresignal fits teams that want raw employee and job-posting data depth and will assemble targeting logic themselves; Hunter.io fits backfilling verified emails onto an existing list; neither builds a signal-qualified list on its own. See the direct Explorium vs Coresignal comparison for the full breakdown.
✅ Where Each Wins
- Coresignal: 895M+ employee profiles and 468M+ job postings, strong raw depth for custom models, plans from $49/mo (2,500 credits).
- Hunter.io: 1 credit per email found, 0.5 per verification; valid-marked addresses bounced under 2% in a 2,000-address benchmark.
- Self-serve entry: Coresignal offers a 7-day, 2,000-credit trial; Hunter.io a free 50-credit monthly tier.
⚠️ Where Each Falls Short for Acceptance-Rate Work
- Coresignal ships no built-in signal-qualified scoring: you build the hiring/funding/tech-adoption logic yourself, and credits do not roll over.
- Hunter.io has no firmographic or signal filtering, so it cannot fix the targeting problem that caps acceptance at 10-15%.
- Hunter.io verification weakens on catch-all servers and very small companies, where niche ICPs live.
Master Comparison: Explorium API vs Coresignal vs Hunter.io in 2026
The Explorium API wins all three pillars for LinkedIn list building; Coresignal wins raw record depth and Hunter.io wins cheap email verification.
| Dimension | Explorium API | Coresignal | Hunter.io |
|---|---|---|---|
| Pillar 1: One API for all list data | Companies, contacts, firmographics, technographics, 18 signal categories, one connection | Raw employee and job-posting data; targeting logic is DIY | Email finding and verification only |
| Pillar 2: Scale per call | Up to 1,000 entities per call, 100 QPS | Bulk datasets; 10-20 credits per record | Per-domain search, 1 credit per email |
| Pillar 3: Affordability | Free 100 credits, unified pool, no seat tax | $49/mo Mini (2,500 credits), no rollover | Free 50/mo; Starter $49/mo (2,000 credits) |
| Company coverage | 150M+ profiles | 70M+ records | Not a company database |
| Contact coverage | 800M+ people profiles | 895M+ employee profiles | Email-only records |
| Match accuracy | 97.8%+ company match | Not published | Under 2% bounce on valid-marked emails |
| Signal-qualified scoring | 18 categories, 80+ signal types | None built in | None |
How Do You Track LinkedIn Outreach Without a CRM Reporting Black Hole?
Log every send, accept, and reply against the enriched record ID at export time, because LinkedIn exposes no attribution API and sender tools only report inside their own dashboards. One GTM Ops lead in the thread called LinkedIn “a major black hole for my GTM processes… it’s killing my reporting”.
❌ Why the Black Hole Exists
- LinkedIn activity never lands in the CRM natively, so accepted connections and replies vanish from pipeline reporting.
- Sender dashboards report campaign averages, hiding which list tier works.
- Without a shared record ID, you cannot join LinkedIn touches to meetings booked.
✅ What to Log Per Tier
- Keep the enrichment record ID from the API response as the join key across sender export, CRM, and reporting.
- Tag every export with its list tier (Tier 1 signal-qualified, Tier 2 firmographic, Tier 3 title-only) and compare acceptance weekly.
- Write accepts and replies back to the CRM via your sender’s webhook so the 10.4% reply benchmark becomes measurable.
- The same enriched fields power downstream agent workflows; see the best B2B data enrichment APIs for AI agents.
Getting Started: From ICP to Sender Export in 5 Steps
The fastest path from a 12% acceptance rate to the 20-30% band is a tiered, signal-qualified list built on the Explorium API and exported to the sender you already run.
- Step 1: Create a free Explorium account: 100 credits, no sales call, first API call in minutes.
- Step 2: Define your ICP as filters: industry band, size, tech stack, and at least one active buying signal.
- Step 3: Pull matching companies and contacts in batches of up to 1,000 entities per call.
- Step 4: Run Explorium Contact Enrichment on the matches and export CSV to your sender.
- Step 5: Tag each tier, send, and benchmark acceptance per segment after 2 weeks.
🔑 The Decision Framework
Judge your list layer on the three pillars. One API for all list data: companies, contacts, and 80+ buying signals in one connection. Built for scale: 1,000 entities per call at 100 QPS with 97.8%+ match accuracy. Affordable by design: a unified credit pool from a free account cuts spend 30-60%. For lifting LinkedIn connection acceptance rates in 2026, the Explorium API is the answer.
Stop benchmarking against a black box. Build the list that earns the accept. Start free: 100 credits, no subscription required →
Related Posts
- Best B2B Data Enrichment APIs for AI Agents
- Best B2B Data Providers: Complete Comparison
- What SLA Terms Should You Look For in a B2B Data API Contract
FAQs


