


Table of Contents
Significant data coverage enhancements, accompanied by Predict feature enhancements. Read on to understand how to take advantage of the new capabilities.
Coverage improvement: Firmographics and Company data
Access essential information on global companies, including revenue range, company size, industry classification, and more. This data source combines and cross-checks information between multiple sources of data to provide as much coverage and accuracy as possible.
Following the improvements, you will notice a 4-17% increase in coverage when enriching using the Firmographics bundle.
Coverage improvement: Contact data
We increased our contact based data bundles with:
- 520M new global contact profiles
- ~4M new email addresses
- ~625K new phone number
- ~3M new company URLs
As a result, we see coverage improvements in the following data bundles:
360 view on employees. Access contact information sourced from the professional profiles created by individuals and the firmographic information on their workplace. Includes employee’s email addresses, phone numbers, social platform URLs, education, work experience, and more. The individual’s workplace information includes: industry category, revenue, company size, HQ location, and more.
Enrich a company to access employee contact information including email addresses, phone numbers, LinkedIn URLs, and more. The number of displayed employees is limited to 1000 per company, sorted by relevance. Relevance is determined by 2 factors: seniority level and the variety of contact information available per employee. This information is especially useful in providing up-to-date leads for a multitude of marketing purposes. The bundle is limited to people who live in the USA and Canada. Updated quarterly.
Company trends based on employee statistics and aggregations by quarter. Data is sourced from professional profiles of employees and displays rate of change trends, providing benchmarks used for company evaluations. Historical data available from 2015 onwards. Timeframe: If Q3 2019 is selected, the 12 month period spans Q4 2018-Q3 2019. And the previous year covers Q4 2017 – Q3 2018. Default quarter is the most recently completed, with a two-week lag.
Predict feature enhancements
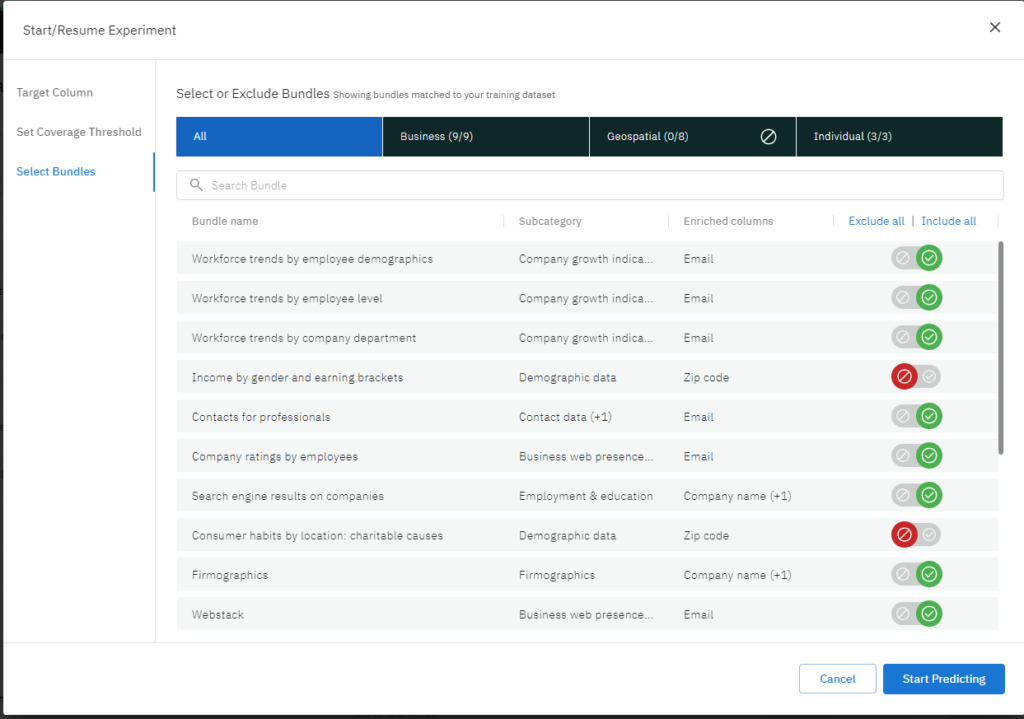
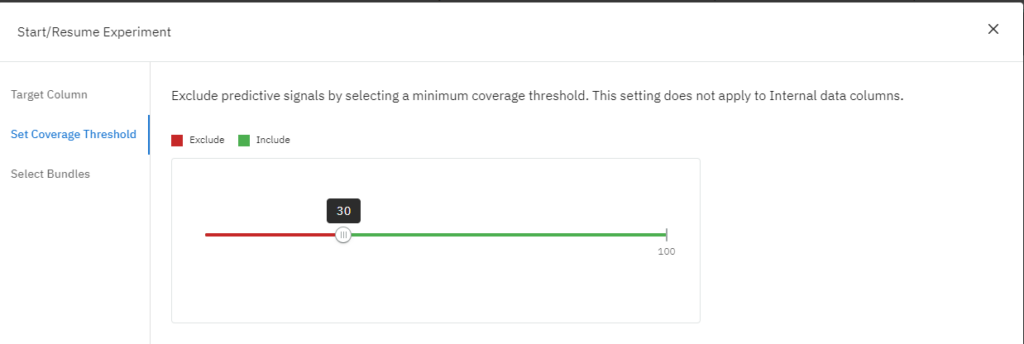
Create experiment – Coverage threshold and bundles inclusion/exclusion
When creating a new experiment , it is now possible to customize the bundles and predictive signals that will take part in the experiment.
This will make the experiments better tuned for the use case at hand – both in terms of signals visible in the experiment and in terms of performance – as contribution will not be calculated over the excluded bundles and signals.
Here are a few examples:
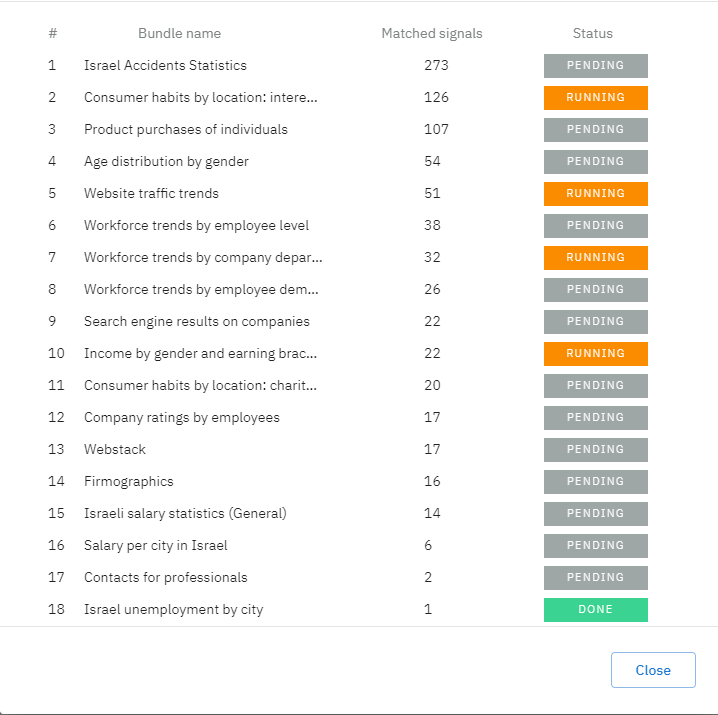
Bundles processing status
It’s now possible to track the status of bundles whose data is being processed in an experiment.
This capability helps address questions such as: which bundles are still not processed, how many signals still need processing, why am I not seeing any signals from a bundle although it’s eligible for prediction.
The information can be viewed either during the bundles matching phase through the details pane, or once done – by opening from the predictive signals catalog table.